Force measurements on cadaveric knees show that the human anterior cruciate ligament (ACL) develops a high resultant force under combined anterior tibial force and internal-rotation moment near extension[4]. Both the force in the whole ACL and the load sharing between its anteromedial (AM) and posterolateral (PL) bundles change with the applied loading condition and the flexion angle[4,5,7,8,9].
1. Reference Zero Points and Physical Meaning of Five Classes of Experimental Measures
Early geometric studies of cadaveric knees recorded changes in path length between attachment sites with fine wires passed through bone. Amis and Dawkins divided the ACL in 27 cadaveric knees into AM, intermediate and PL bundles; in path-length tests (n = 9) they anchored fine wires at the femoral attachment, passed them out through a central tunnel at the tibial attachment to a displacement transducer, and defined 0° of full extension as the arbitrary zero[1]. During unconstrained passive flexion–extension from 0° to 130°, the paths of all three bundles lengthened markedly over the last 30° of extension; from 0°, all three first shortened, the AM bundle reaching a minimum near 30° of flexion (about −1.1 mm) and then lengthening again in deep flexion to about +2.8 mm at 130° (a total excursion of about 4 mm), whereas the PL bundle continued to shorten to a minimum near 90° (about −4.9 mm) and was about −3.9 mm at 130°[1]. Applied axial rotation moments of ±1 N·m did not change bundle lengths significantly; internal rotation tended only slightly to lengthen the paths relative to external rotation near 30°. In sequential sectioning under a 150 N anterior tibial load (n = 9), the PL bundle contributed the largest share of anterior resistance at 20° of flexion, and the AM bundle the largest share at 90°; however, the sum of the three mean percentage contributions read from Fig. 8 of that paper at 20° is about 104%–105%, exceeding 100%, so the specific percentage values for each bundle in that figure cannot be used as an exact partition and serve only to show the reversal of which bundle predominates between 20° and 90°[1]. The authors state clearly that taking 0° of extension as zero is an arbitrary choice; the experiment did not determine the true zero-tension length at which the fibers leave the slack state, and positive or negative millimeter differences reflect only changes in attachment-site distance relative to 0°[1].
To measure local relative deformation of intra-articular ligament fibers after they tighten, Fleming et al. mounted a Hall-effect strain transducer (HEST) on the anterior surface of the AM bundle in 9 cadaveric knees (mean age 63 years) and, about 2 mm proximal to the proximal fixation prong of the HEST, implanted an implantable force probe (IFP) within the AM fibers solely as a criterion of tension; during anteroposterior shear cycles at 30° of flexion they drew a tangent to the slack region of the shear–displacement curve and took the slack–tight transition where the curve left that tangent as the zero-strain reference length l₀, which did not differ significantly from the onset of tension detected by the force probe in either reference length (P = 0.24) or the corresponding anterior shear force (P = 0.47)[2]. Subsequent in vivo arthroscopic studies under local anesthesia continued to use the HEST or a differential variable reluctance transducer (DVRT) and calculated local engineering strain on the anterior surface of the AM bundle as ε = (l − l₀) / l₀ × 100%, but the flexion angle used to calibrate l₀ (20° or 30°) and the range of anteroposterior shear were not uniform across papers[3,6,10]. These values reflect only local deformation of superficial AM fibers; they do not represent the PL bundle or the resultant force in the whole ACL. A negative ε indicates only that the local fibers are shorter than the slack–tight transition length and are slack; it does not mean that they are under compressive stress[2,3,6,10].
In situ forces (N) in the whole ACL or in its separated bundles in cadaveric knees have been measured with two classes of apparatus. Markolf et al. freed a tibial bone plug carrying the ACL attachment and connected it to a three-degree-of-freedom load cell, zeroing the electrical output in an unloaded position at 30° of flexion with the tibia posterior, to read the three-dimensional resultant force in the whole ACL[4]. Sakane et al.[5], Li et al.[7], Gabriel et al.[8] and Wu et al.[9] used a six-degree-of-freedom robot with a universal force-moment sensor (UFS): they first recorded the three-dimensional position of the intact knee under load, then cut the whole ACL or sectioned one bundle in sequence and strictly reproduced the original three-dimensional position, calculating in situ force from the difference in force vectors before and after sectioning. Uniaxial tensile tests of thin slices cut longitudinally from within the ligament without bony attachments have been used to measure nominal tensile stress and modulus (MPa)[12,13]. In noninvasive in vivo dynamic studies, three-dimensional bone-model tracking and reference-length calibration are separate steps: investigators first reconstruct tibiofemoral bone models from CT (Nagai et al.[14], Kamada et al.[21]) or MRI (Taylor et al.[11], Englander et al.[15,18], Foody et al.[19,20]) and track skeletal motion with biplane radiography (or with skin-marker motion capture calibrated by static radiography); they then take the attachment-region center-to-center distance in a supine MRI posture (0°–17° of flexion; Nagai et al.[14] tracked with CT bone models and measured the reference length on supine full-extension MRI[11,14,15]) or a supine CT posture (mean flexion 6.5° ± 3.5°[21]) as l₀ and compute dynamic relative elongation. Because static supine scanning does not determine the slack–tight transition, in vivo relative elongation of attachment-site distances, path-length change measured with through-bone wires (mm), local intra-articular engineering strain (%), in situ force in cadaveric knees (N), and tensile stress in ACL tissue slices (MPa) belong to five different physical quantities, each with its own reference zero (Table 1); values from different methods cannot be converted directly into one another, and percentages referred to different zeros cannot be added[1,2,4,12,15,16,17].
Table 1. Comparison of five classes of experimental methods for ACL tension and deformation
| Measurement method and physical quantity | Definition of the reference zero | Anatomic sampling | Principal limits of interpretation |
|---|---|---|---|
| Through-bone wire path-length change (mm)[1] | Arbitrary path length at 0° of extension | Lines joining the centers of bone tunnels for the AM, intermediate and PL bundles | True zero-tension length not measured; negative values mean only shorter than the 0° position |
| Local intra-articular engineering strain (%)[2,3,6,10] | Slack–tight transition where the shear–displacement curve leaves the tangent to the slack region, at 20° or 30° of flexion | Local superficial fibers on the anterior surface of the AM bundle | Does not represent the PL bundle or the resultant force in the whole ACL; negative values mean slack and unloaded in tension |
| In situ force in cadaveric knees (N)[4,5,7,8,9] | Electrical zero in an unloaded posterior position at 30° (bone-cap method), or force-vector difference before and after sectioning (robotic method) | Whole ACL, or AM and PL bundles after artificial separation | Cadaveric specimens have no neuromuscular reflexes; bundle forces depend on soft-tissue retention and the method of bundle sectioning |
| Tensile stress and modulus of ACL tissue slices (MPa)[12,13] | Initial gauge length under a 0.1 N preload | Longitudinal slices without bony insertions from the AM and PL bundles | Transverse cross-links are cut and there is no bone block; modulus and failure stress are about an order of magnitude lower than in bone–ligament specimens |
| In vivo relative elongation of attachment-site distances from 3D bone models (%)[11,14,15,18,19,20,21] | Attachment-region center-to-center distance on supine MRI (0°–17° of flexion) or supine CT (6.5° ± 3.5°) | Whole ACL, or center-to-center lines of two bundles divided 50/50 at the midpoint of the attachment axis | Static scanning does not determine the slack–tight transition; straight-line distance ignores wrapping of fibers around bone and torsion |
2. In Situ Force Sharing Under Passive Flexion–Extension and Multiplanar External Loads, and Bundle Material Mechanics
Under conditions with no applied anterior tibial force, axial rotation moment, varus–valgus moment or simulated muscle pull, Markolf and colleagues in 1990[22], 1996[23] and 2008[24] successively connected a freed tibial bone cap (also called a bone plug) carrying the ACL insertion to a load cell and recorded the resultant force in the intact native ACL during passive extension of cadaveric knees. The three cadaveric series agree: even without applied tibial loads or simulated muscle forces, the intact native ACL maintains only low readings at flexion angles greater than 10°, and the resultant rises sharply over the last 10° of extension (from 10° to 0° of full extension); the 1990[22] and 1996[23] studies, which included hyperextension, found that the mean resultant at −5° of hyperextension rose further above the value at 0° (the 2008 study[24] tested only from 120° to 0°). Because specimen age and fixture support differed among the three experiments, and because some studies do not independently state a complete definition of 0° or the posture at which the load cell was electrically zeroed, absolute resultant forces (N) near 0° cannot be equated across studies or assembled into a single "normal resting tension" for the living unloaded knee[22,23,24]. Likewise, these passive tension curves, obtained from cadaveric knees without muscle activity or ground-reaction force, cannot be used to convert noninvasive in vivo relative elongation of attachment-site distances during gait (%) into ligament force (N), nor can the low-force state of the cadaveric native ACL beyond 10° of flexion be translated, without reference to graft tunnel geometry, initial fixation stiffness and biologic remodeling, into a safe flexion-angle threshold for rehabilitation after ACL reconstruction[22,23,24].
The 1990 Markolf study (supported by NIH R01-AR37037) enrolled 17 fresh-frozen cadaveric knees (donor age 56–68 years); a bone cap containing the intact tibial ACL attachment was freed and fixed to a three-component load cell, and with the femur fixed, tibial rotation unconstrained, no quadriceps tendon pull and no applied joint-contact force, the tibia was manually extended against gravity from 90° of flexion to −5° of hyperextension[22]. The text reports a group mean resultant force in the whole ACL at 0° of full extension of 42 N (Discussion, p. 565), with an individual range of 16–87 N (Results, p. 561); at −5° of hyperextension the group mean rose to 118 N (Abstract, p. 557), and the Results give an individual range of 50–241 N (p. 561; the Abstract writes 50–240 N)[22]. The mean plot on p. 561 shows only the interval from −5° to 45° (45°–90° is not drawn): reading the solid black mean curve labeled "NO QUADRICEPS TENDON PULL," ACL force falls rapidly from −5° and 0° toward flexion, is about 6 N at 10° of flexion, and remains at a low level of about 3 N from 20° to 45°, so that the authors' statement that ligament force beyond 10° of flexion is "negligible" corresponds to readings of a few newtons rather than a strict zero[22].
Figures and legends on pages 561 and 562 of that paper were swapped in layout: the graphic labeled Fig. 2 on p. 561 in fact plots the two group-mean curves with and without a 200 N quadriceps tendon pull, whereas the legend beneath describes individual passive curves for all specimens; the graphic labeled Fig. 3 on p. 562 in fact plots the individual curves without quadriceps pull for the 17 specimens, whereas its legend describes the two mean curves and states that the error bars are 95% confidence intervals of the mean; the Results text likewise cites the two figures according to the mismatched legends, and only the in-figure legend on p. 561 ("NO QUADRICEPS TENDON PULL, N = 17") correctly identifies the passive mean curve[22]. The definition of 0° of full extension is inconsistent within the paper: the Methods (p. 558) define it as the tibiofemoral angle obtained under a 2.5 N·m extension moment, whereas the Discussion (p. 565) rewrites it as 2 N·m; the authors also note that differences in posterior capsular tightness among specimens alter the 0° position defined by moment, and the paper never states the posture at which the load cell was electrically zeroed for the passive flexion–extension sequence[22]. On specimen screening and bench verification, the Discussion (p. 566) mentions that some specimens were discarded because of bone-cap fixation failure without reporting the initial number of specimens; bench checks showed mean cross-talk of 6% and 12% in the load-cell channels at 30° and 45° of obliquity, respectively, and displacement checks under a 200 N anterior force in 3 specimens showed 0.6–1.2 mm of posterior bone-cap migration with secondary structures sharing 2–18 N (from which the authors estimated underestimation of ACL force under anterior loading by 1%–9%)[22]. As for the Abstract and Discussion drawing from the low-force state of the cadaveric native ACL beyond 10° of flexion the inference that passive motion from 10° to full flexion after ACL repair or reconstruction is "safe" and that early rehabilitation should avoid active or passive extension to 0° (pp. 557, 565–566), that inference lacks postoperative clinical follow-up and cannot be used as a basis for restricting patients' postoperative extension[22].
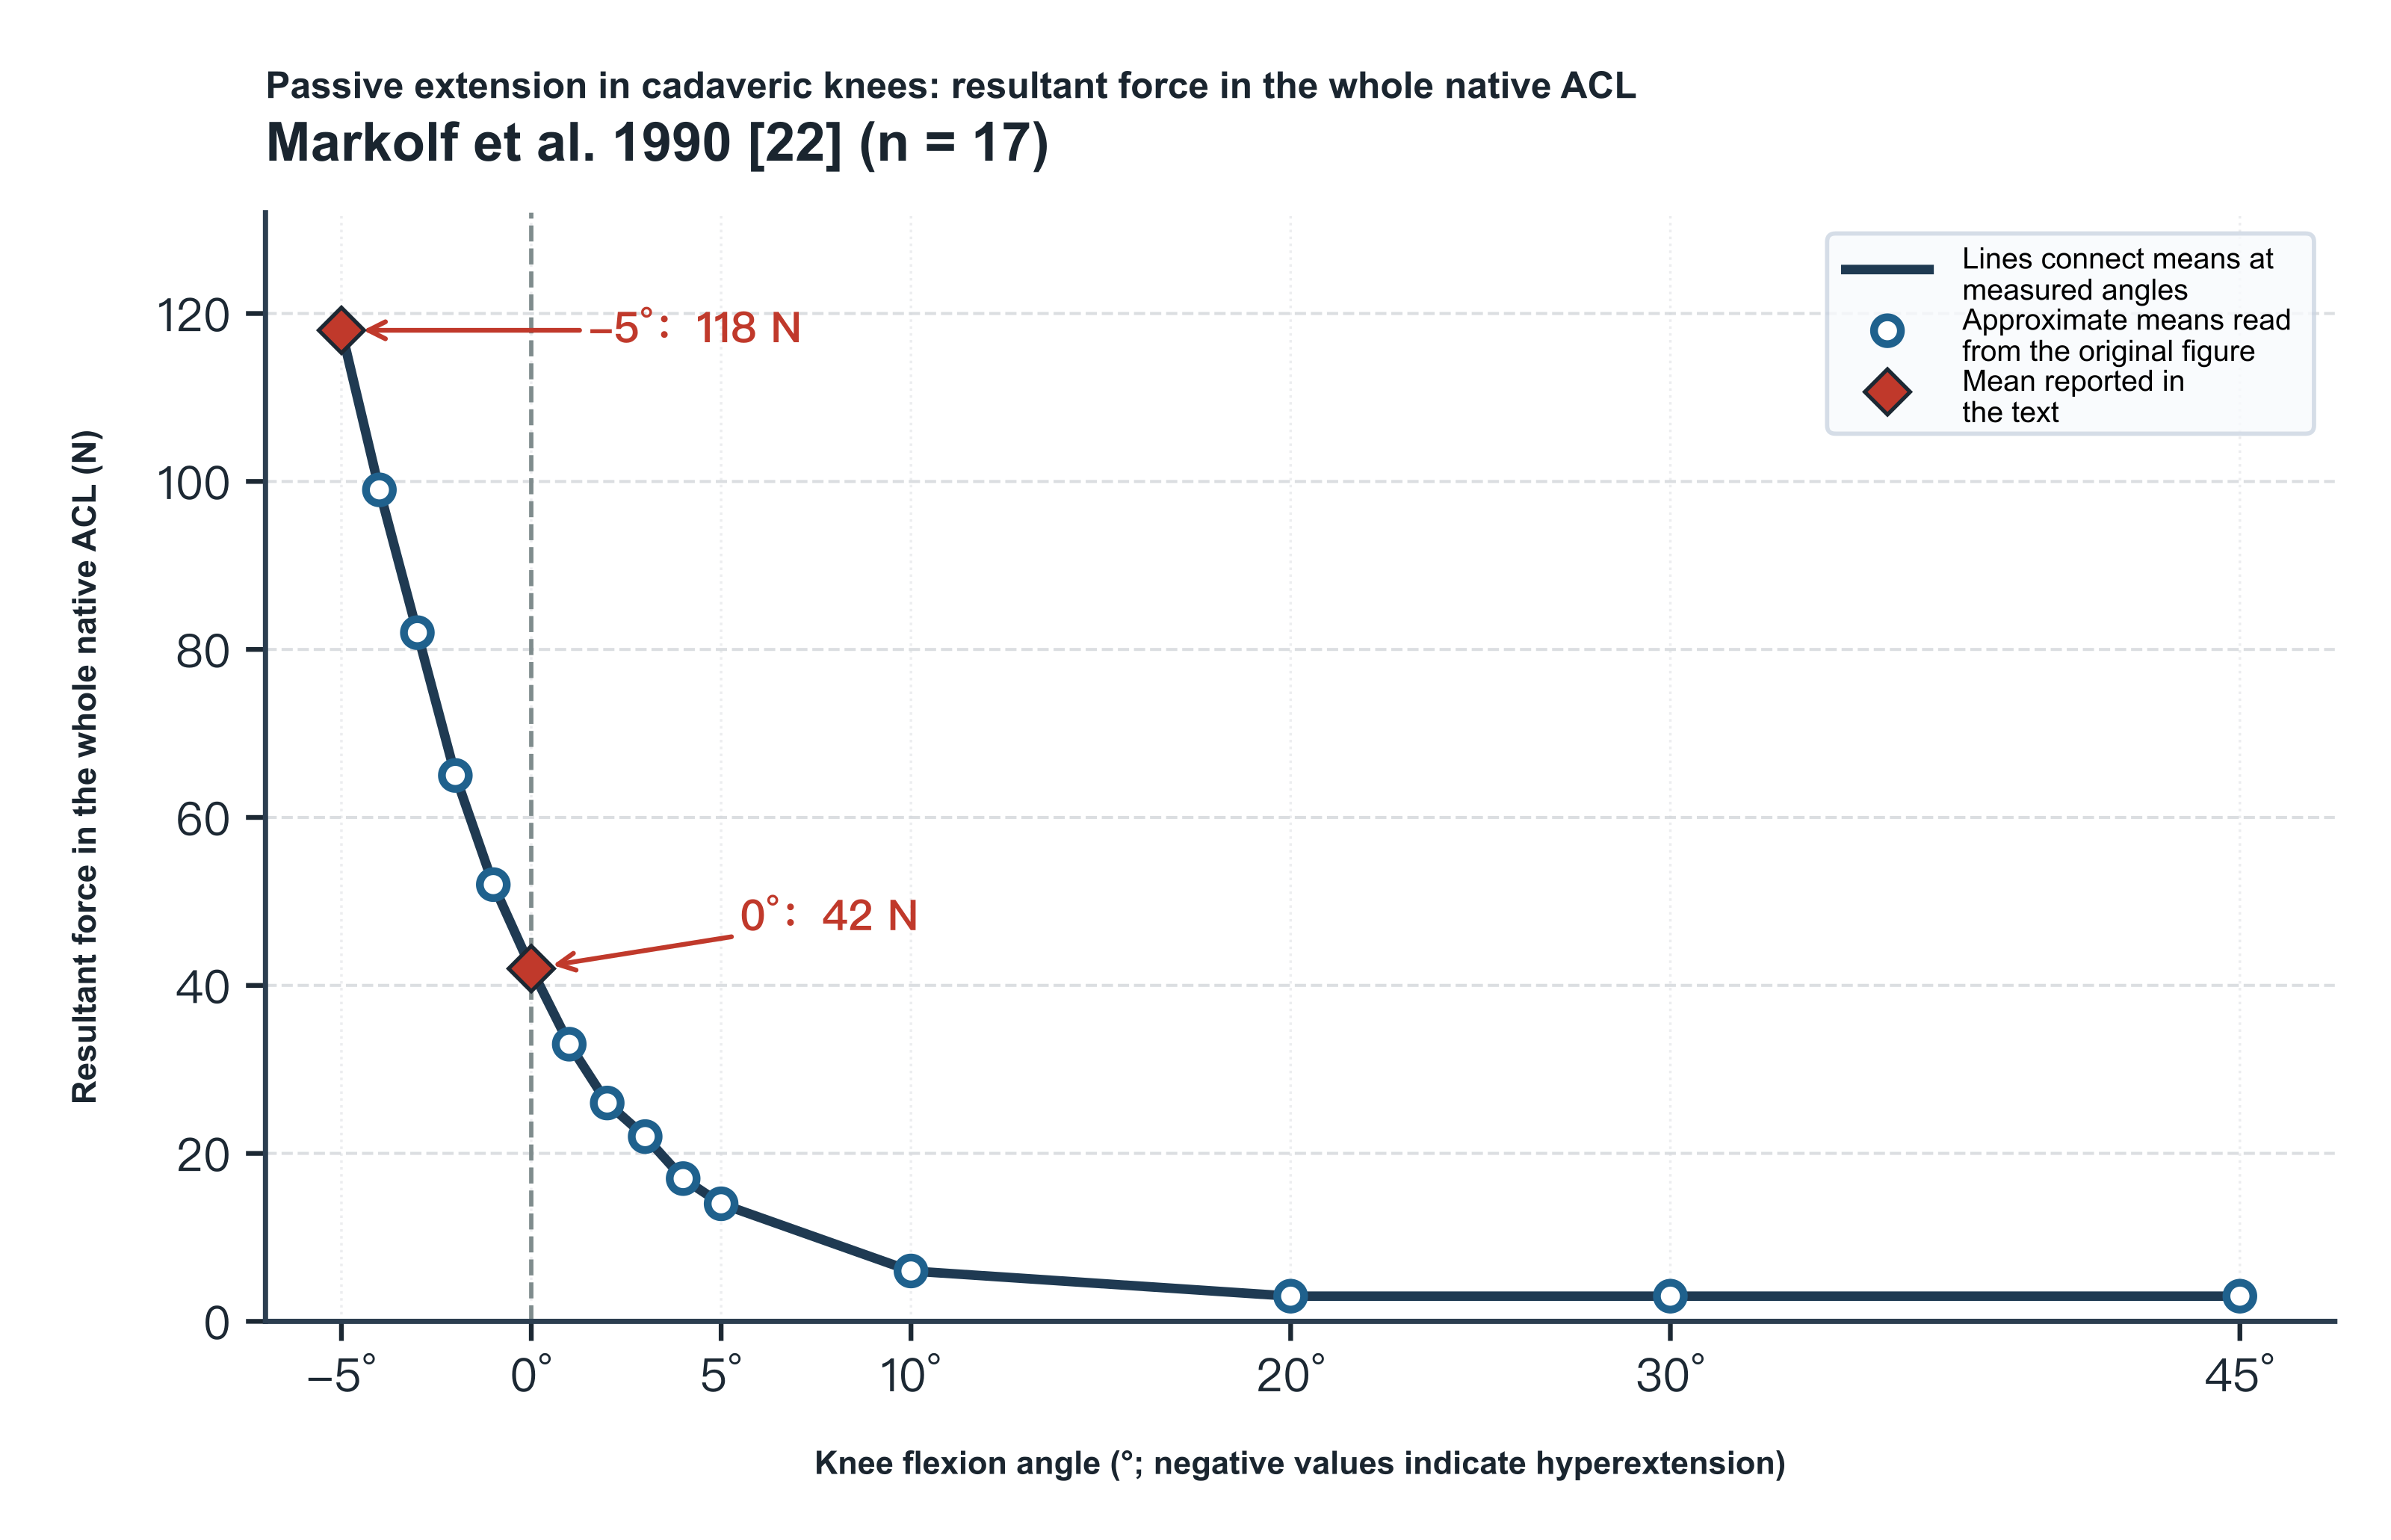
Figure 1. Resultant force in the intact native ACL during passive extension of cadaveric knees without applied tibial load or quadriceps pull (Markolf et al. 1990[22], n = 17, ages 56–68 years). A freed tibial insertion bone cap was connected to a three-component load cell to measure the resultant force in the whole ACL (N) directly, with the femur fixed and the tibia extended manually from 90° of flexion to −5° of hyperextension (tibial rotation unconstrained; the original mean plot shows only −5° to 45°). Diamonds are means reported in the text (−5°, 118 N; 0°, 42 N); circles are approximate readings from the mean curve labeled Fig. 2 on p. 561 of the original (reading tolerance about ±2 N; because figures and legends on pp. 561 and 562 were swapped in layout, this figure redraws only the mean points identifiable from the in-figure legend and does not redraw the original error bars).
In the 1996 Part II study by Markolf et al. (supported by NIH R01 AR40330, the Orthopaedic Research and Education Fund and the Dorothy and Leonard Straus Fund, with related interests assigned to associated research funds or nonprofit institutions; allograft patellar tendons donated by the Musculoskeletal Transplant Foundation), the femur was fixed to a flexion–extension bar and the distal tibial extension rod was supported on rollers between parallel horizontal plates (bearing housing and lower support rod counterbalanced by pulley weights, allowing tibial axial rotation and varus–valgus in the horizontal plane); without applied tibial load or simulated muscle force, the femur was extended manually at about 10°/s from 90° of flexion to −5° of hyperextension[23]. Although the Abstract states that the whole study comprised 17 male fresh-frozen cadaveric knees and the Methods describe a main analysis group of 13 knees plus 4 specimens with poorly placed graft tunnels, the intact-ACL passive-extension curve in Fig. 3 on p. 1730 (solid black circles, legend "INTACT ACL (N = 12)") has an actual sample of 12 knees[23]. At 0° of full extension the Abstract reports a precise mean resultant of 56 N in the intact ACL, and the Results (p. 1730) give an individual range of 18–110 N; approximate means read from Fig. 3 at other angles are about 110 N at −5° of hyperextension, about 30 N and 20 N at 5° and 10° of flexion, about 15 N from 20° to 40°, and about 10 N from 50° to 90°[23].
The Discussion (p. 1733) summarizes intact ACL force from 40° to 90° as "nominally zero," yet Fig. 3 shows mean points in that interval persistently slightly above the zero line (about 10–15 N); these can be understood only as low-level forces within reading tolerance, neither rewritten as an exact 0 N nor interpreted as a constant "baseline pretension" in the living ligament[23]. In addition, this part of the series refers specimen preparation and load-cell mounting to Part I and does not independently report donor age, the operative definition of 0°, or the posture of load-cell zeroing; the text mentions bone-cap fracture or collateral ligament tear in some specimens during testing (p. 1729 once calls a failed bone cap the "proximal ACL attachment," which conflicts with the Abstract and Introduction stating that the load cell was connected to the tibial [distal] insertion bone cap), but does not explain why the intact-ACL curve in Fig. 3 has one fewer specimen than the main group of 13, and the downward error bars in the low-force region of Fig. 3 (described in the legend as one standard deviation of the sample mean) overlap the solid circles and the abscissa, with no angle-by-angle standard-deviation table in the text, so only the mean curve is redrawn here[23].
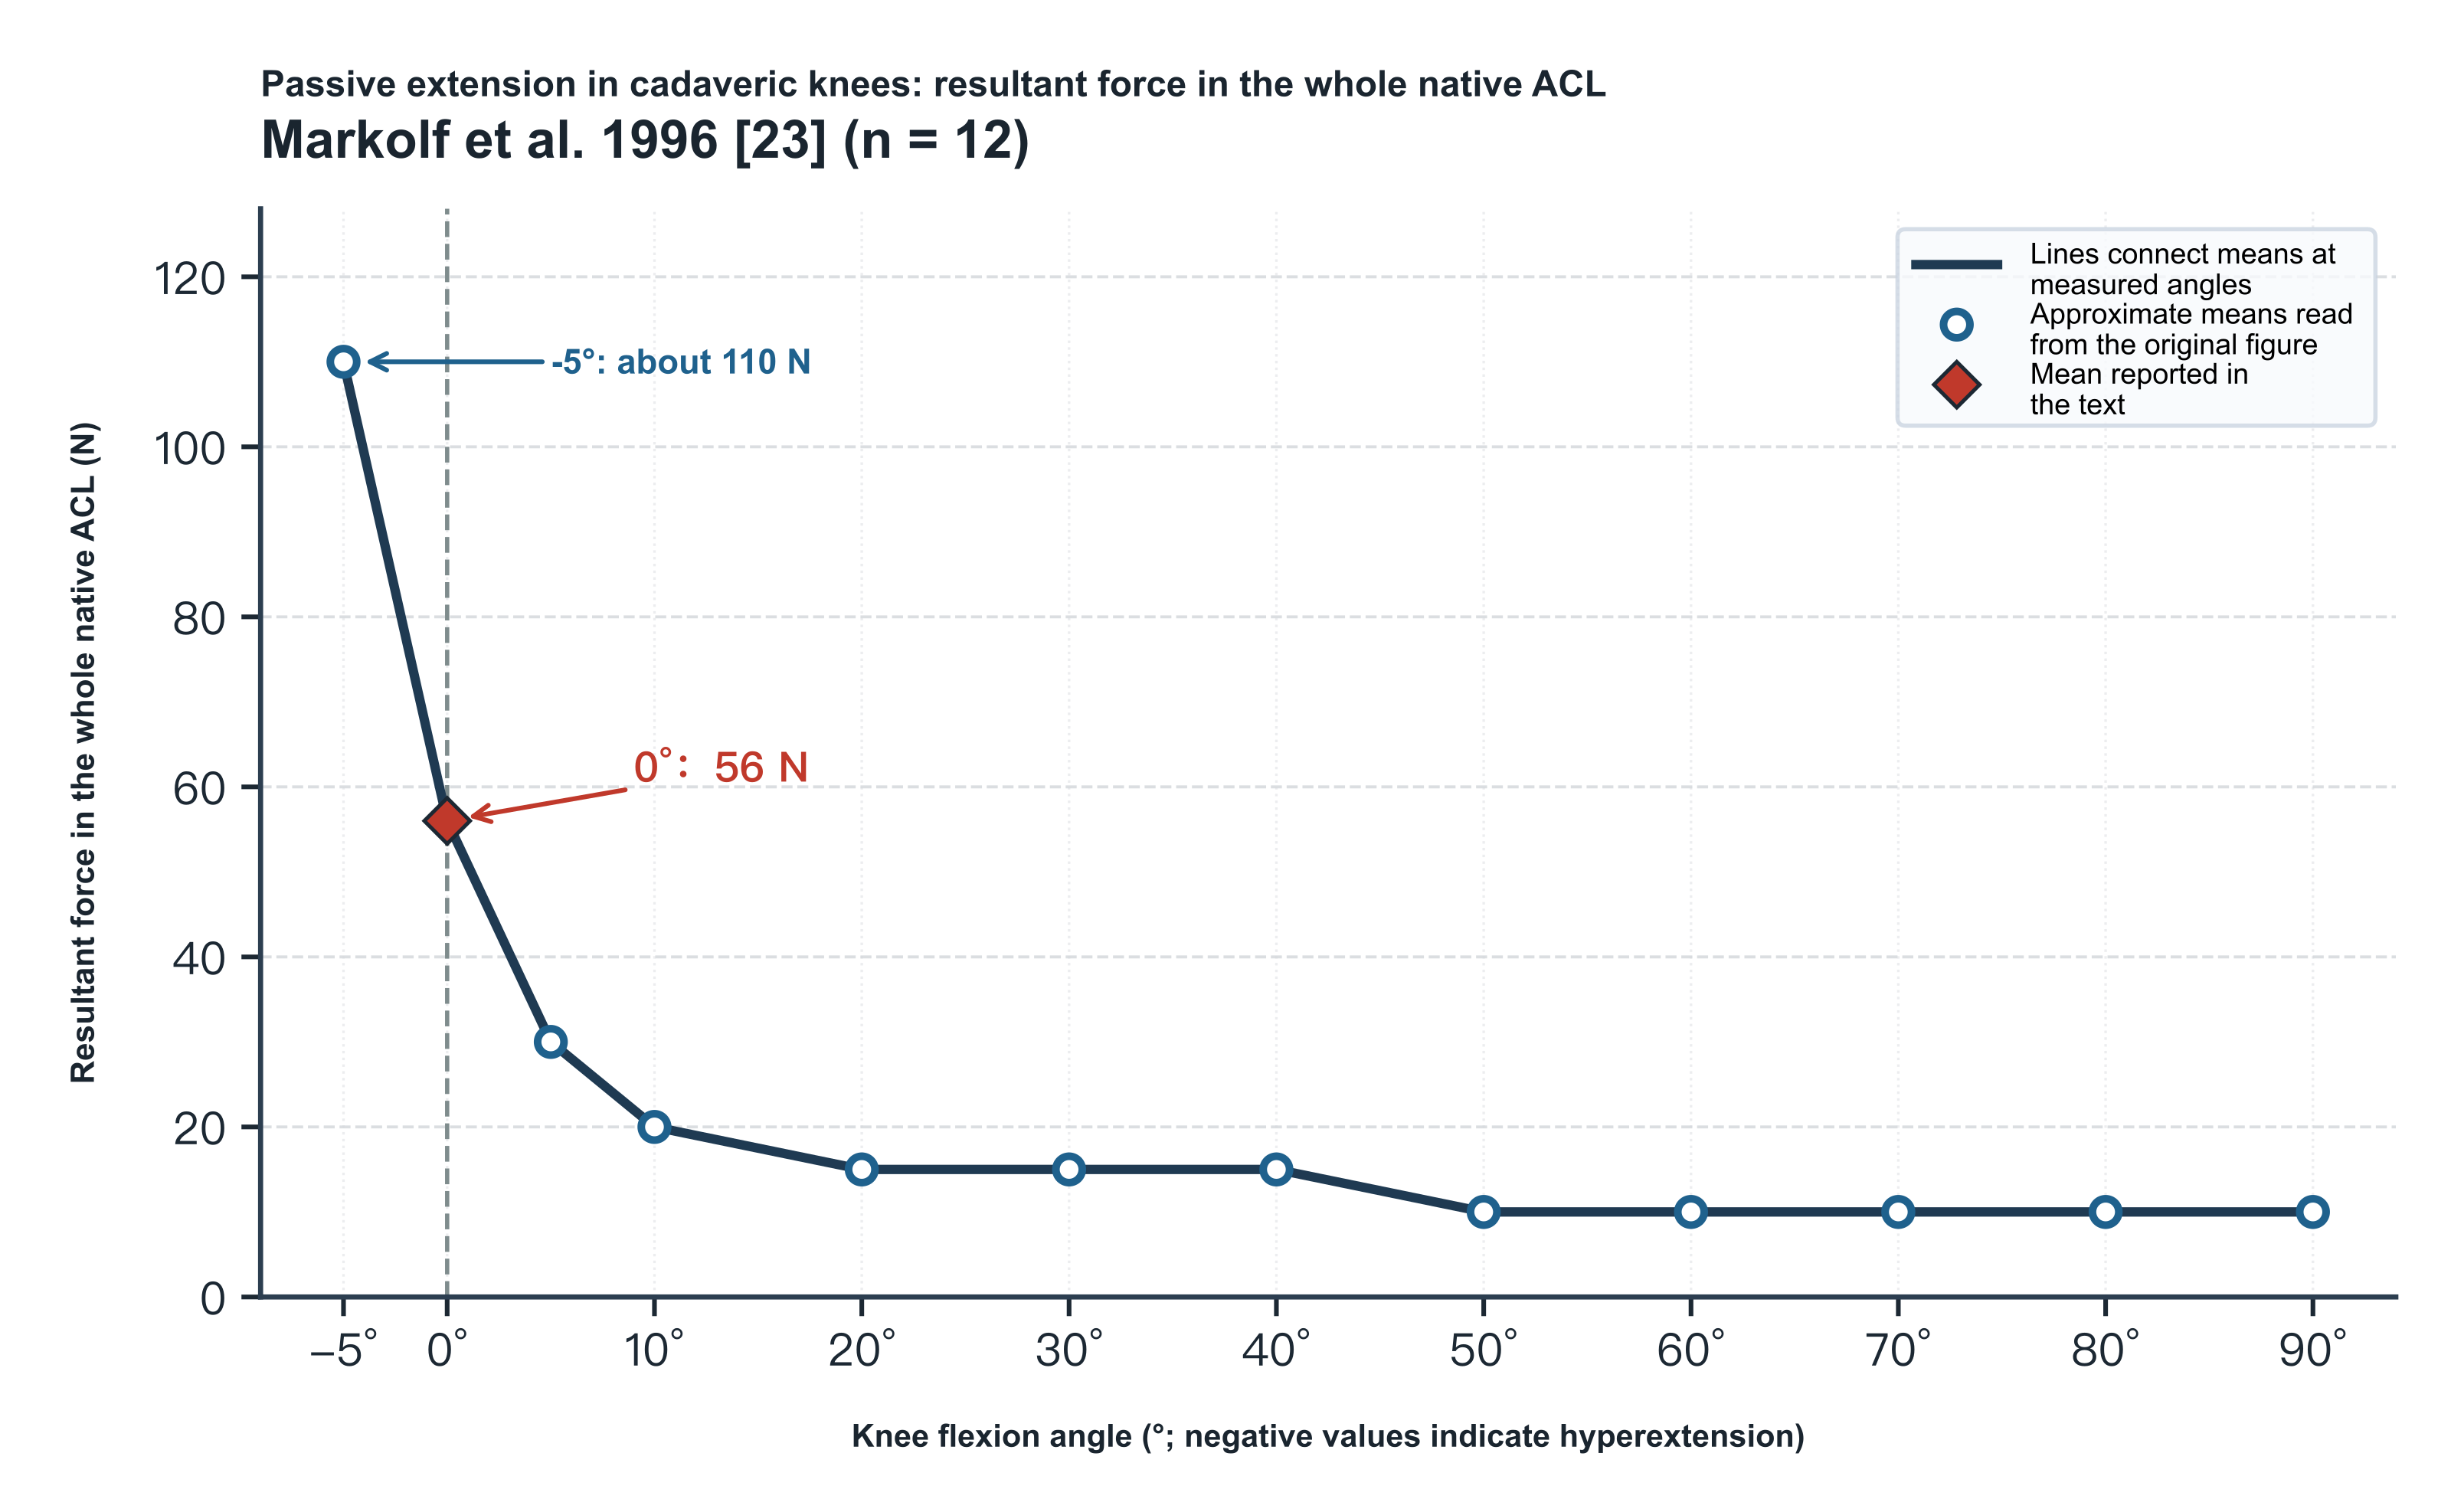
Figure 2. Resultant force in the intact native ACL during passive extension of cadaveric knees without applied tibial load or simulated muscle force (Markolf et al. 1996[23]; intact ACL in Fig. 3, actual n = 12). A freed tibial insertion bone cap was connected to a load cell to measure the resultant force in the intact native ACL of male cadaveric knees (N) directly, with the tibia held horizontal and free to rotate axially and in varus–valgus in the horizontal plane, and the femur extended manually at about 10°/s from 90° of flexion to −5° of hyperextension. The diamond is the mean at 0° reported in the Abstract (56 N); circles are approximate readings from the "INTACT ACL" mean curve in Fig. 3 on p. 1730 of the original (rounded to 5 N; reading tolerance about ±5 N; because symbols and error bars overlap in the low-force region of the original and the text has no angle-by-angle numerical table, only mean points are redrawn, without the original error bars).
The 2008 Markolf study (supported by NFL Charities, with tissue provided by the Musculoskeletal Transplant Foundation) likewise connected a freed tibial insertion bone cap to a load cell and recorded the passive-extension resultant from 120° of flexion to 0° of full extension in 12 male fresh-frozen cadaveric knees (mean age 36.6 ± 9.6 years, range 17–46 years; hyperextension was not tested, and tibial internal–external rotation and varus–valgus were unconstrained during passive extension)[24]. The paper does not provide a complete angle-by-angle numerical table for the intact ACL without applied tibial force; approximate means read from the solid black intact-ACL curve in the lower set of curves in Fig. 2 on p. 806 ("No Anterior Force") are about 69 N at 0° of full extension (about 26 N at 5°, about 12 N at 10°), falling to about 3–4 N in mid-flexion from 30° to 60° and remaining about 7–8 N in deep flexion from 75° to 120°[24]. When reading the Abstract and Results (pp. 805–806) one must distinguish carefully: the "31 N" reported precisely in the text at 0° under the no–anterior-force condition is the drop in mean ACL resultant at 0° after the PL bundle fibers had been cut from the lateral wall of the femur at 90° of flexion (corresponding to the difference at 0° in Fig. 2 between the intact ACL at about 69 N and the open circles after PL sectioning at about 38 N; among the discrete comparison angles shown in Fig. 2, only 0° and 5° differed significantly before and after sectioning, and all points at 10° and beyond were marked nonsignificant), and must not be mistaken for the resultant in the intact ACL at 0°[24].
The figures and text of that paper also contain several reporting defects: the Abstract, Methods and Results all state that the tested motion was "passive extension" from 120° to 0°, yet the titles and legends of Figs. 2–5 all mislabel it "passive flexion"; the words "graft forces" or "graft tissues" appear in the purpose statements of the Abstract and Introduction and in the funding footnote on p. 805, and twice in the Methods on p. 806, whereas the actual experiment measured only the native ACL before and after cutting the PL bundle and did not perform graft reconstruction testing[24]. In addition, the legend to Fig. 1 (anteroposterior laxity) states clearly that error bars are 1 SD, whereas the legend to Fig. 2 and the text do not specify the statistic represented by the small error bars on the curves, and details of load-cell zeroing and the definition of 0° are referred only to prior literature[24]. On methodological inference, the authors acknowledge in the Discussion (pp. 807–808) that equating the drop in force after cutting the PL bundle with the force that had been carried by the PL bundle is only a rough assumption, and that limited posterior notch visibility at 90° of flexion may occasionally have led to inadvertent injury of some AM fibers when the femoral attachment of the PL bundle was separated, exaggerating the force drop (a risk that affects only the post-sectioning difference, not the intact-ACL passive curve before sectioning)[24]. The study therefore supports a clear rise in the passive resultant of the intact native ACL near 0° of extension, but the 31 N sectioning difference cannot be unconditionally equated with an independently measured absolute PL-bundle force, nor used to assert that the PL bundle constantly carries half the load of the whole ACL at 0° or to set intraoperative tension protocols for double-bundle reconstruction[24].
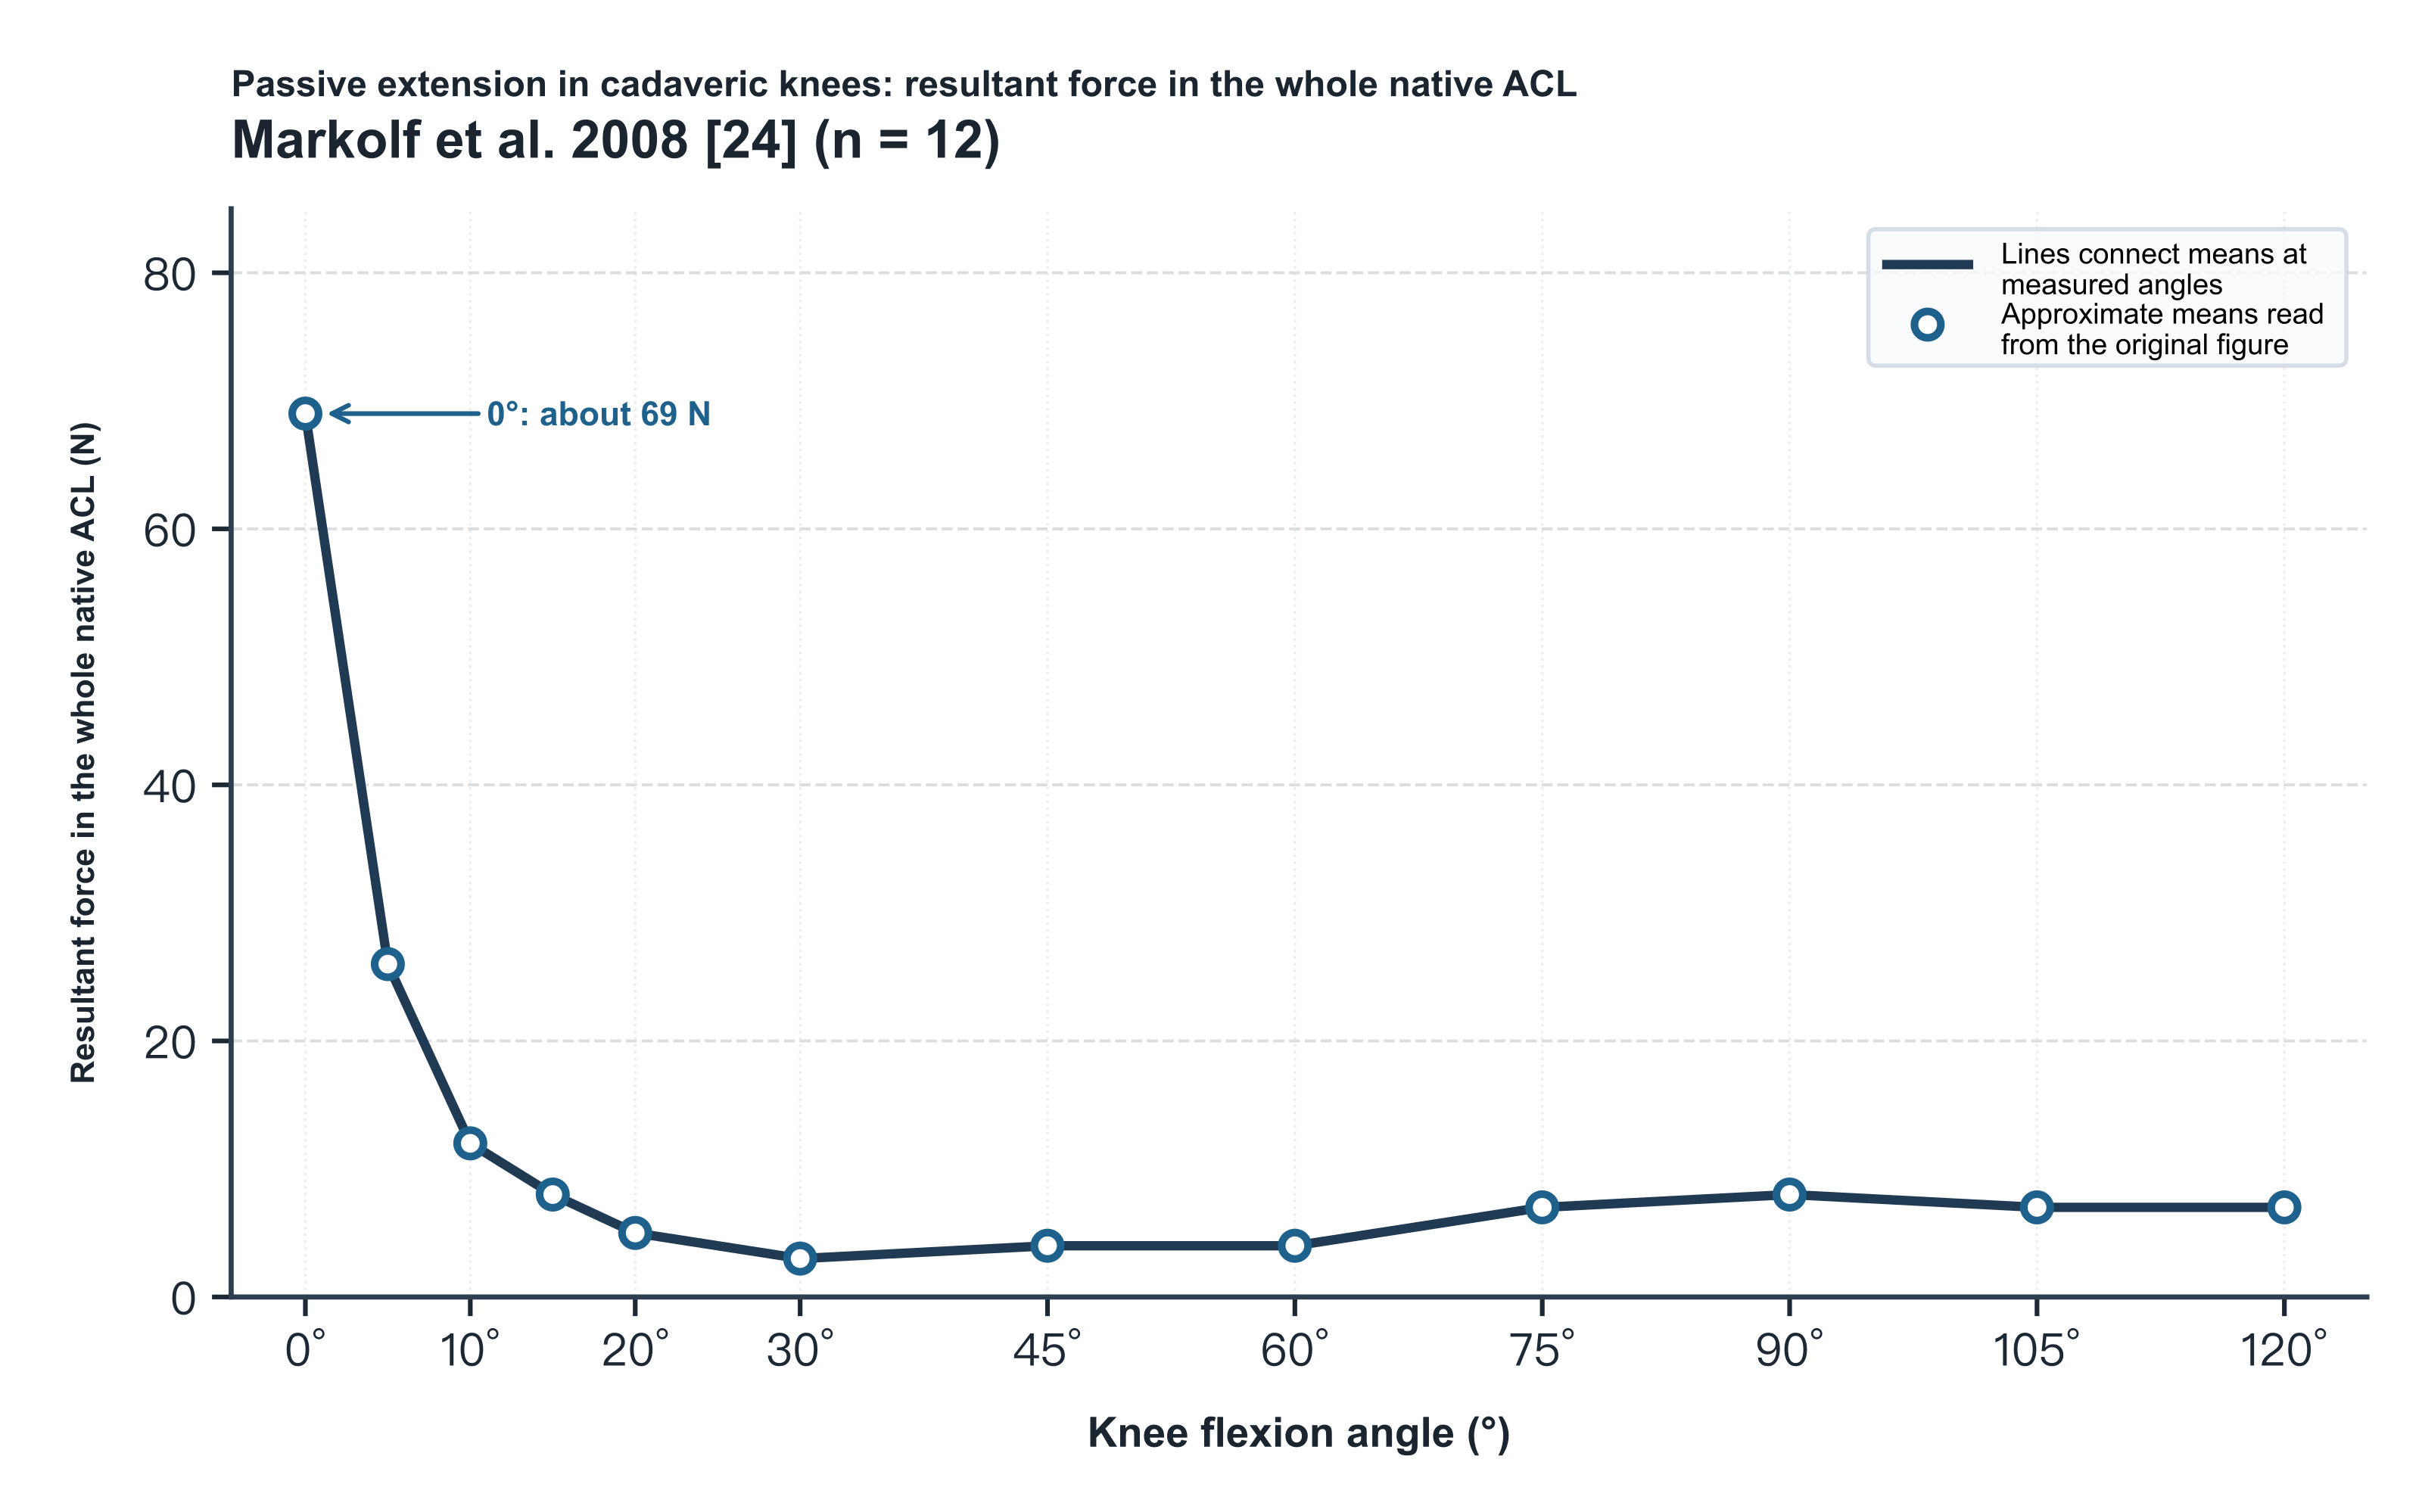
Figure 3. Resultant force in the intact native ACL during passive extension of cadaveric knees without applied tibial load or simulated muscle force (Markolf et al. 2008[24], n = 12, male, 36.6 ± 9.6 years). A freed tibial insertion bone cap was connected to a load cell to measure the resultant force in the intact native ACL (N) directly, with tibial internal–external rotation and varus–valgus unconstrained, from 120° of flexion to 0° of passive extension (hyperextension not tested). Circles are approximate readings from the intact-ACL mean curve in the lower set of curves in Fig. 2 on p. 806 of the original ("No Anterior Force"; reading tolerance about ±2 N; because the original does not specify the statistic for the Fig. 2 error bars, only mean points are redrawn).
At the level of the whole-ACL resultant, Markolf et al. passively extended 14 cadaveric knees (ages 50–78 years) from 90° of flexion to −5° of hyperextension under 5 isolated external loads and 8 pairwise load combinations (under high combined loads some cancellous bone caps failed mechanically; effective n = 12–14, and the original does not map missing specimens case by case to each figure)[4]. Under an isolated 100 N anterior tibial force, ACL resultant force (mean ± SD; values marked "about" are readings from the original mean curves) rose from about 100 N at 30° of flexion to about 150 N at 0° and about 175–185 N at −5° of hyperextension; an isolated 10 N·m internal-rotation moment produced about 220–230 N at 0° and about 240–250 N at −5°, and an isolated 10 N·m valgus moment produced about 40–85 N across angles[4]. The effects of two-load combinations changed direction with flexion angle: 100 N anterior force plus 10 N·m internal rotation was significantly higher than anterior force alone at <20° (about 270 N at 0°, nearly 300 N at −5°, the highest loads in the whole experiment), did not differ significantly from 20° to 40°, and at deeper flexion >40° actually made ACL force lower than anterior force alone; 100 N anterior force plus 10 N·m external rotation significantly reduced ACL force at >10°[4]. By contrast, 100 N anterior force plus 10 N·m valgus significantly raised the resultant over the full range >5° (reaching about 200 N at 20°–30°), and 10 N·m internal rotation plus 10 N·m valgus was also higher than internal rotation alone from 10° to 70°[4]. The authors proposed that near extension in internal rotation the ACL may wind about a taut posterior cruciate ligament (PCL), and that in external rotation the medial collateral ligament (MCL) may share anterior force, but the experiment did not directly measure PCL or MCL tension[4].
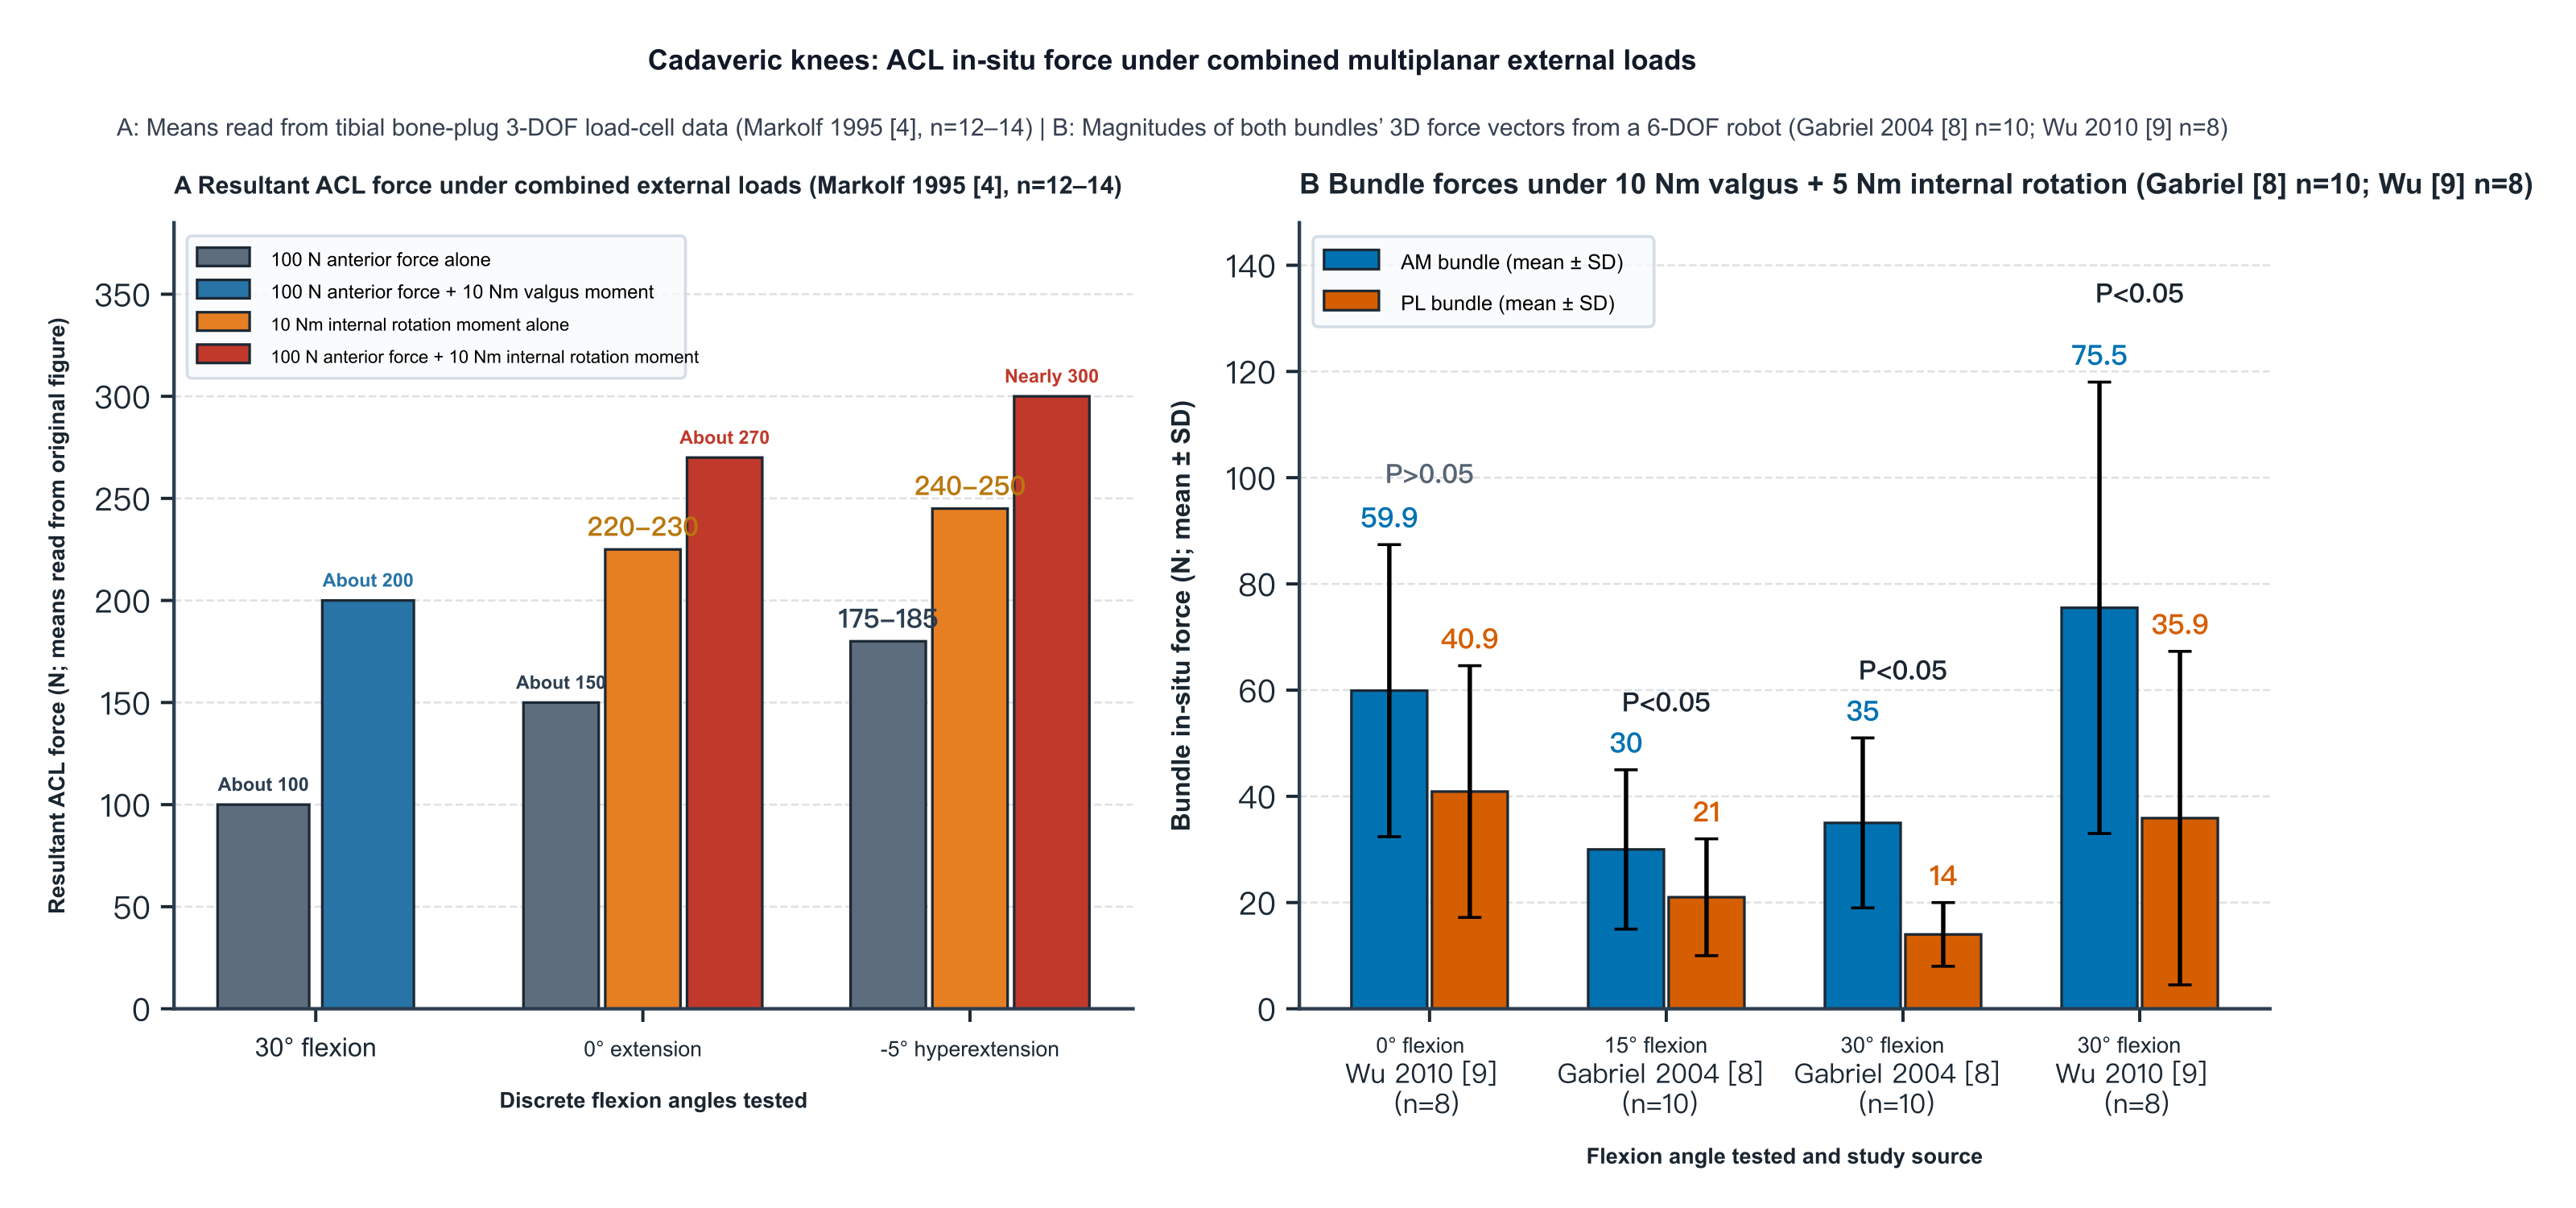
Figure 4. In situ forces in the whole ACL (A) and in the AM and PL bundles (B) of cadaveric knees under multiplanar combined external loads. A: approximate mean readings (N, no error bars) from the original figures of Markolf et al. 1995[4] (n = 12–14), measured with a tibial bone-plug three-degree-of-freedom load cell at 30° of flexion, 0° of extension and −5° of hyperextension, comparing an isolated 100 N anterior force, 100 N anterior force plus 10 N·m valgus, an isolated 10 N·m internal-rotation moment, and 100 N anterior force plus 10 N·m internal rotation. B: magnitudes of the three-dimensional force vectors in the AM and PL bundles (N, mean ± SD) under a combined 10 N·m valgus plus 5 N·m internal-rotation moment measured with a six-degree-of-freedom robot and UFS (Gabriel et al. 2004[8], n = 10, reported at 15° and 30°; Wu et al. 2010[9], n = 8, reported at 0° and 30°).
To clarify the shares carried by the AM and PL bundles under anterior tibial and rotational loads, Sakane et al.[5], Gabriel et al.[8] and Wu et al.[9] measured in situ forces in the two bundles with a six-degree-of-freedom robot and UFS (Table 2). Under 110 N or 134 N anterior loads, Sakane et al. and Gabriel et al. found that the resultant in the whole ACL peaked at 15° of flexion (110.6 ± 14.8 N and 119 ± 24 N, respectively; Wu et al. reported only bundle forces); in all three studies PL-bundle in situ force was highest near extension at 0°–15° and fell markedly with deeper flexion (in Sakane et al. under 110 N the PL bundle still retained 26.2 ± 14.4 N at 90°)[5,8,9].
Table 2. Comparison of three six-degree-of-freedom robotic studies of in situ forces in the ACL bundles
| Comparison | Sakane 1997[5] | Gabriel 2004[8] | Wu 2010[9] |
|---|---|---|---|
| Specimens and soft tissues | 9 knees (mean age 71 years); anterior arthrotomy; menisci and collateral ligaments retained | 10 knees (reported 50 ± 10 years); remaining soft tissues cut after motion recording; bundles cut with bone blocks | 8 knees (mean age 55 years); femoral insertion bundles cut alternately and sutured; surrounding soft tissues retained |
| Definition of in situ force | Projection onto the resultant-force axis of the whole ACL | Magnitude of the three-dimensional force vector | Magnitude of the three-dimensional force vector |
| Anterior load (110 or 134 N) | 110 N: at 0° and 15°, PL > AM (at 15°, PL 75.2 ± 18.3 N); at 60°, AM (47.4 ± 34.2 N) > PL; no significant differences for AM across angles | 134 N: at 0°, PL (67 ± 30 N) > AM (48 ± 16 N); no significant difference at 15°; from 30° to 60°, AM > PL (peak 90 ± 17 N at 60°) | 134 N: AM > PL at all 5 angles from 0° to 90°; AM peaked at 30° (123.7 ± 26.3 N), PL at 0° (51.3 ± 19.5 N) |
| Rotational or muscle loads | Rotation and muscle loads not tested | 10 N·m valgus + 5 N·m internal rotation: AM > PL at both 15° and 30° | 10 N·m valgus + 5 N·m internal rotation: no significant difference at 0°, AM > PL at 30°; 400 N quadriceps: no significant difference between bundles from 0° to 90° |
| Principal methodological and reporting limits | The 45° point in Fig. 6 is the intersection of the 30°–60° connecting line, not a measured angle | If age ±10 years means SD, it is incompatible with the sample extremes; Fig. 2 includes an unexplained 120°; Sakane's surgical approach misstated | Combined-rotation Methods list 5 angles; Results and Fig. 4 report only 0° and 30° |
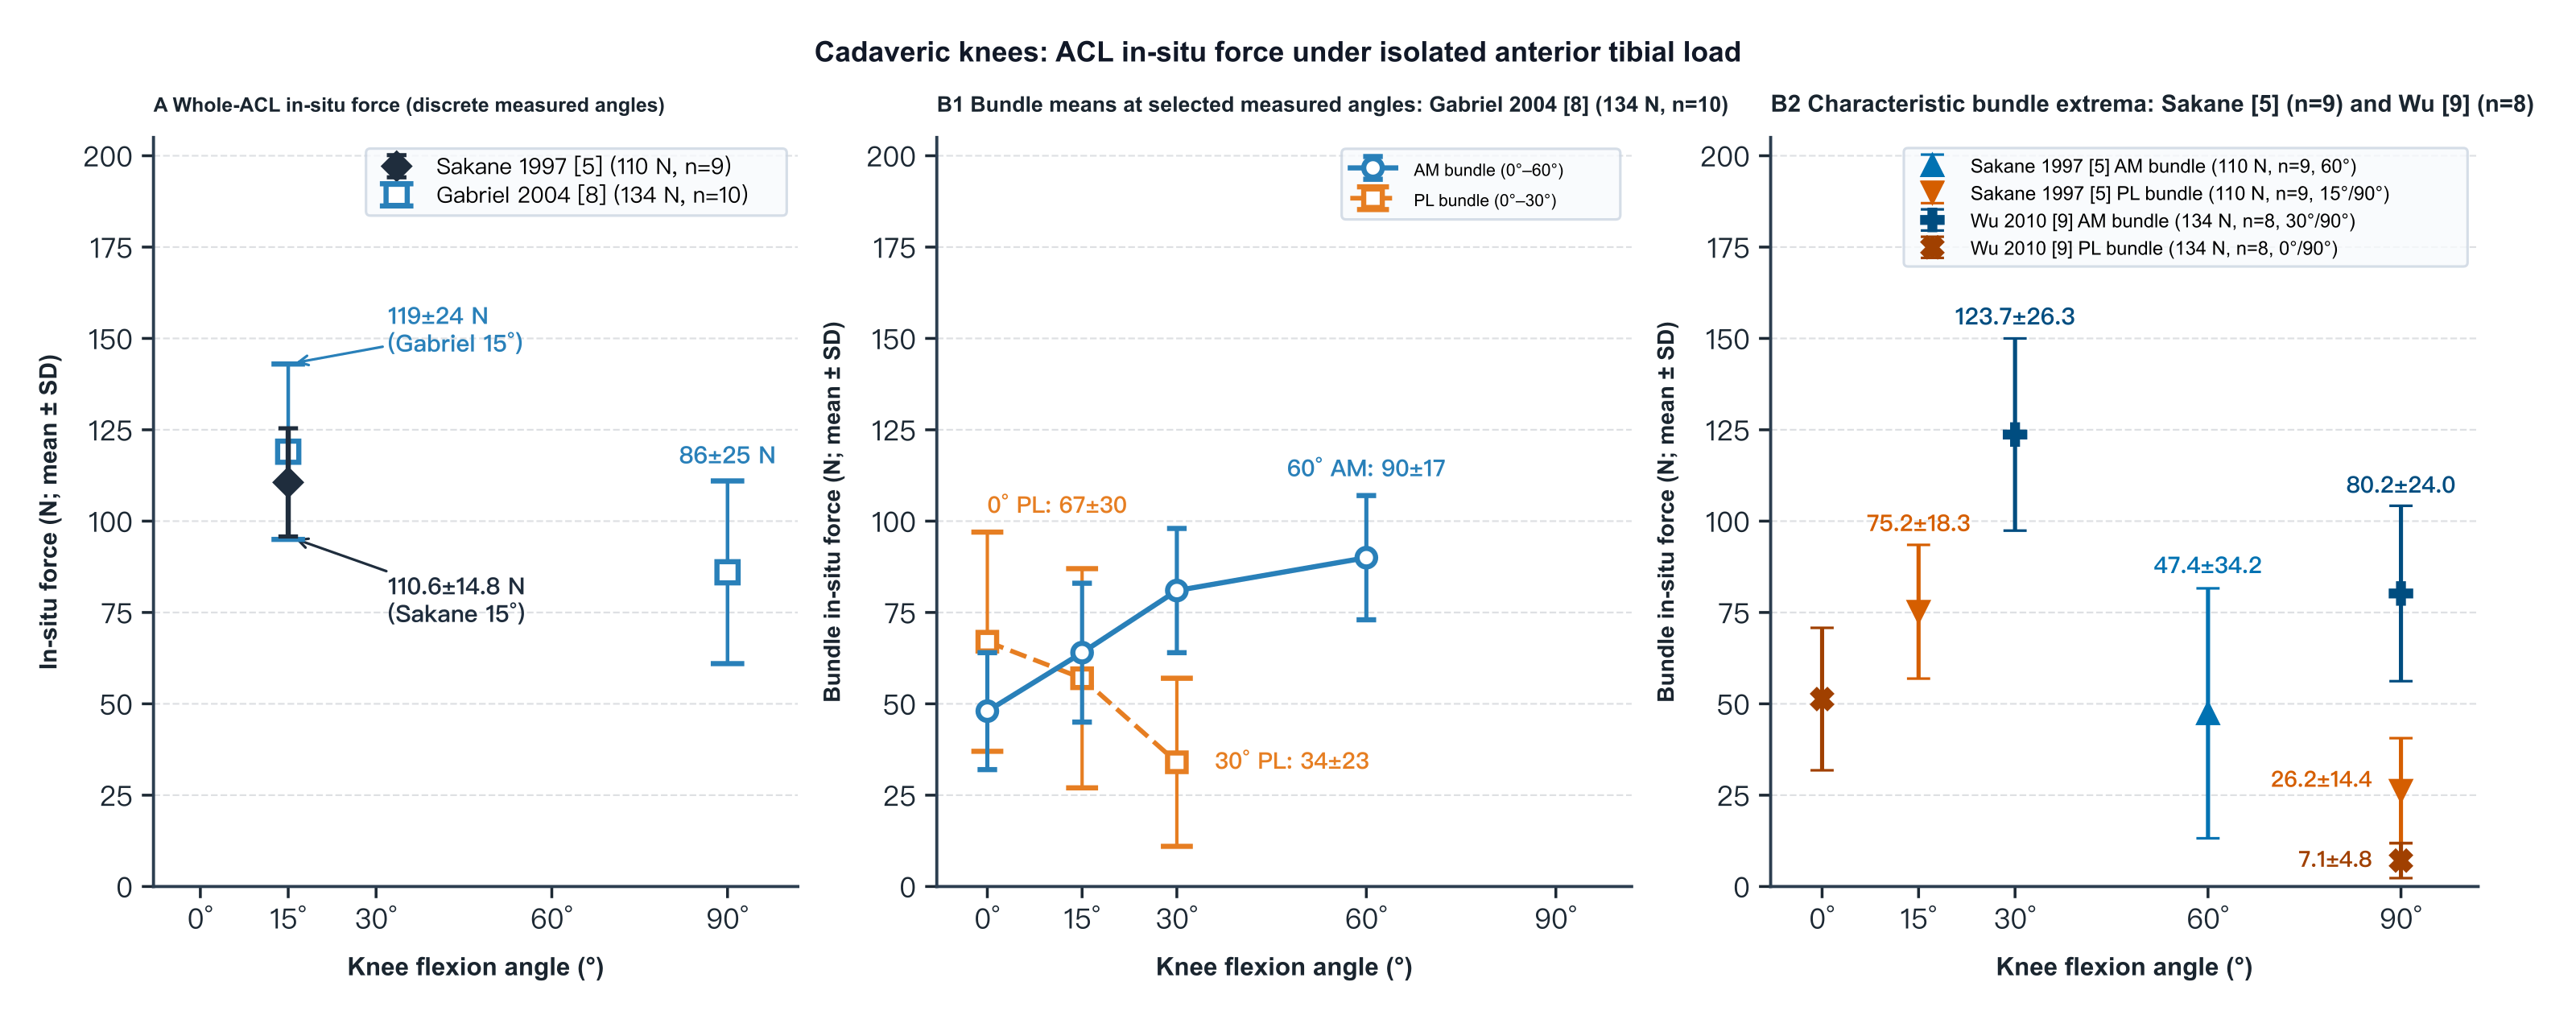
Figure 5. In situ forces in the whole ACL (A) and in the AM and PL bundles (B1, B2) of cadaveric knees under isolated anterior tibial load (six-degree-of-freedom robot with UFS; N, mean ± SD). The abscissa is positioned at 0°, 15°, 30°, 60° and 90° of flexion. A: whole-ACL in situ force at each discrete measured flexion angle from Sakane et al. 1997[5] (110 N, n = 9) and Gabriel et al. 2004[8] (134 N, n = 10). B1: mean bundle values at selected measured flexion angles from Gabriel et al. 2004[8] (134 N, n = 10), connected by lines. B2: peak values at the reported peak angles and readings at 90° of deep flexion from the text of Sakane et al. 1997[5] (110 N, n = 9; projection onto the whole-ACL resultant axis) and Wu et al. 2010[9] (134 N, n = 8; magnitude of the three-dimensional force vector).
The three studies do not agree on which bundle predominates near extension. Mathematically, Sakane et al. took the projection of each bundle force onto the resultant-force axis of the whole ACL, which attenuates bundle components that deviate from the principal axis, whereas Gabriel et al. and Wu et al. computed the magnitude of the three-dimensional force vector and retained all orthogonal components; the three studies also differ in mean specimen age (71 years versus 50–55 years) and in whether surrounding soft tissues and joint-surface contact were retained when motion was replayed, factors that may affect cross-study comparison, although existing experiments have not directly tested whether they produce the different bundle rankings[5,8,9]. Sakane et al. also reported that under a 110 N anterior load the angle α between the AM-bundle force vector and the tibial plateau fell from 22.8° ± 6.6° at 0° to 7.4° ± 14.6° at 90° (P < 0.05), whereas the PL-bundle angle did not change significantly; AM-bundle in situ force did not differ significantly between 0° and 60° (P = 0.105) or between 15° and 90° (P = 0.548)[5]. Under a combined 10 N·m valgus plus 5 N·m internal-rotation moment, the two bundles did not differ significantly at 0° (Wu et al.: 59.9 ± 27.5 N versus 40.9 ± 23.7 N), whereas at 15° and 30° the AM bundle was significantly higher than the PL bundle (Gabriel et al.: 30 ± 15 N versus 21 ± 11 N at 15°, 35 ± 16 N versus 14 ± 6 N at 30°; Wu et al.: 75.5 ± 42.5 N versus 35.9 ± 31.4 N at 30°); under a 400 N quadriceps load (Wu et al.), both bundles were clearly loaded from 0° to 30° (AM peak 75.2 ± 48.7 N at 15°, PL peak 51.5 ± 41.6 N at 30°) and both fell below 25 N by 60°–90°[8,9]. In addition, the age stated in the Methods of Gabriel et al. (p. 86) as "50 ± 10 years (46–66 years)" cannot hold mathematically if ±10 years is the sample SD with n = 10 and extremes of 46–66 years (maximum possible SD ≈ 8.43 years); Fig. 2 (p. 87) plots a 120° bar not explained in the text; and the Discussion (p. 88) misstates Sakane et al.'s anterior arthrotomy as an arthroscopic procedure[5,8].
At the level of tissue material properties, Skelley et al.[12] and Castile et al.[13] used the same set of 16 cadaveric ACLs (11 donors, mean age 41 years; supported by OREF) and cut longitudinal fiber-aligned slices without bony attachments from each bundle (96 strips prepared in all; specimens that failed at the clamps were discarded, but the number discarded per bundle and the final effective sample size were not reported). After 10 cycles of triangular-wave preconditioning from 0% to 3% strain, each specimen was held at 5% nominal clamp strain for 300 s to measure stress relaxation[13], unloaded for 60 s of recovery (degree of recovery not quantified), then pulled quasistatically to failure with quantitative polarized-light imaging (qPLI)[12]. In the quasistatic failure phase, Skelley et al. prescribed in the Methods and figure legends median and interquartile range with Mann–Whitney comparison of the two bundles (yet the Abstract writes a t-test, the failure-stress text on p. 933 writes "mean," and handling of within-knee and bilateral-donor correlation is not stated): toe-region modulus (7.2 MPa versus 4.2 MPa, P < 0.001), linear-region modulus (27.0 MPa versus 16.1 MPa, P = 0.017) and failure stress at peak force (2.8 MPa versus 2.0 MPa, P = 0.021) were all significantly higher in the AM than in the PL bundle, with no significant difference in bilinear transition strain (P = 0.156)[12]. qPLI showed no significant difference between bundles at zero strain in mean degree of linear polarization (AVG DoLP) or in the standard deviation of angle of polarization (SD AoP); under load the AM bundle had higher AVG DoLP in the linear region (0.22 versus 0.19, P = 0.036) and at failure (0.23 versus 0.19, P = 0.016), and smaller SD AoP at the transition, in the linear region (18.4° versus 22.5°, P = 0.014) and at failure (18.6° versus 22.8°, P = 0.010), supporting more consistent collagen-fiber orientation in the AM bundle under tension[12].
In the 300 s constant-strain stress-relaxation phase, Castile et al. used a restricted maximum-likelihood linear mixed model to handle within-ACL and bilateral-donor correlation and reported medians: AM-bundle peak stress at 0 s (0.31 MPa versus 0.16 MPa, P = 0.049) and stress at 300 s (0.21 MPa versus 0.10 MPa, P = 0.004) were both significantly higher than in the PL bundle, whereas the median relative percentage drop in stress within 300 s for a single specimen was slightly higher in the PL bundle (35.1% versus 32.6%, P = 0.016; stress at 300 s was still falling and had not reached true equilibrium)[13]. However, the Results and Fig. 5A of that paper show that absolute AVG DoLP was higher in the AM bundle at 0 s (0.215 versus 0.170, P = 0.020) and at 300 s (0.208 versus 0.168, P = 0.021), yet the overall relative drop in AVG DoLP over 300 s did not differ significantly between bundles (AM 2.3% versus PL 1.1%, P = 0.065); the Discussion nevertheless contradicts this by claiming that the overall DoLP change was significantly larger in the AM bundle[13]. Because longitudinal slices cut transverse cross-links and have no bone-block attachments, their modulus and failure stress are about an order of magnitude lower than those of bone–ligament bundle specimens and are suitable only for relative comparison of the two bundles within the same system[12].
3. Modulation of ACL Load by Muscle Contraction, Joint Loading, and Rehabilitation Exercises
The active muscle groups about the knee modulate ACL load directly by changing anteroposterior tibial shear and rotational position. Li et al., using a six-degree-of-freedom robot and UFS in 10 cadaveric knees (ages 42–72 years), compared an isolated 200 N quadriceps pull with a combined 200 N quadriceps plus 80 N hamstring co-contraction (both applied along the femoral long axis)[7]. Under isolated 200 N quadriceps loading (mean ± SD), anterior tibial translation peaked at 30° of flexion (5.3 ± 2.1 mm), whereas whole-ACL in situ force was 27.8 ± 9.3 N at 0° and peaked at 15° of flexion (44.9 ± 13.8 N, significantly higher than at all other angles, P < 0.05; original Fig. 6), falling to about 10 N at 90° and 120° of deep flexion, showing that peak anterior tibial translation and peak ACL in situ force need not occur at the same flexion angle[7]. After addition of an 80 N hamstring pull, anterior tibial translation decreased significantly from 30° to 120° (to 4.3 ± 1.5 mm at 30°, with internal rotation falling from 7.5° ± 4.3° to 5.1° ± 2.3°), and whole-ACL in situ force fell significantly at 15°, 30° and 60°, including a drop at 15° of flexion to 34.7 ± 11.8 N (a 23% decrease from isolated quadriceps loading; original Fig. 6), with no significant differences at 0°, 90° or 120°[7]. The closing sentence of the Abstract states that adding the hamstrings reduced in situ force at 15° by 30%, but the measured means in the Results (44.9 N to 34.7 N) and Fig. 6 give an actual reduction of 23%; the Abstract's 30% overstates the unloading from hamstring co-contraction at 15° of shallow flexion. The experiment applied constant axial muscle forces only to cadaveric knees with an intact ACL, and the Discussion's suggestion of deep-flexion training beyond 60° early after surgery has not been validated in postoperative clinical trials[7].
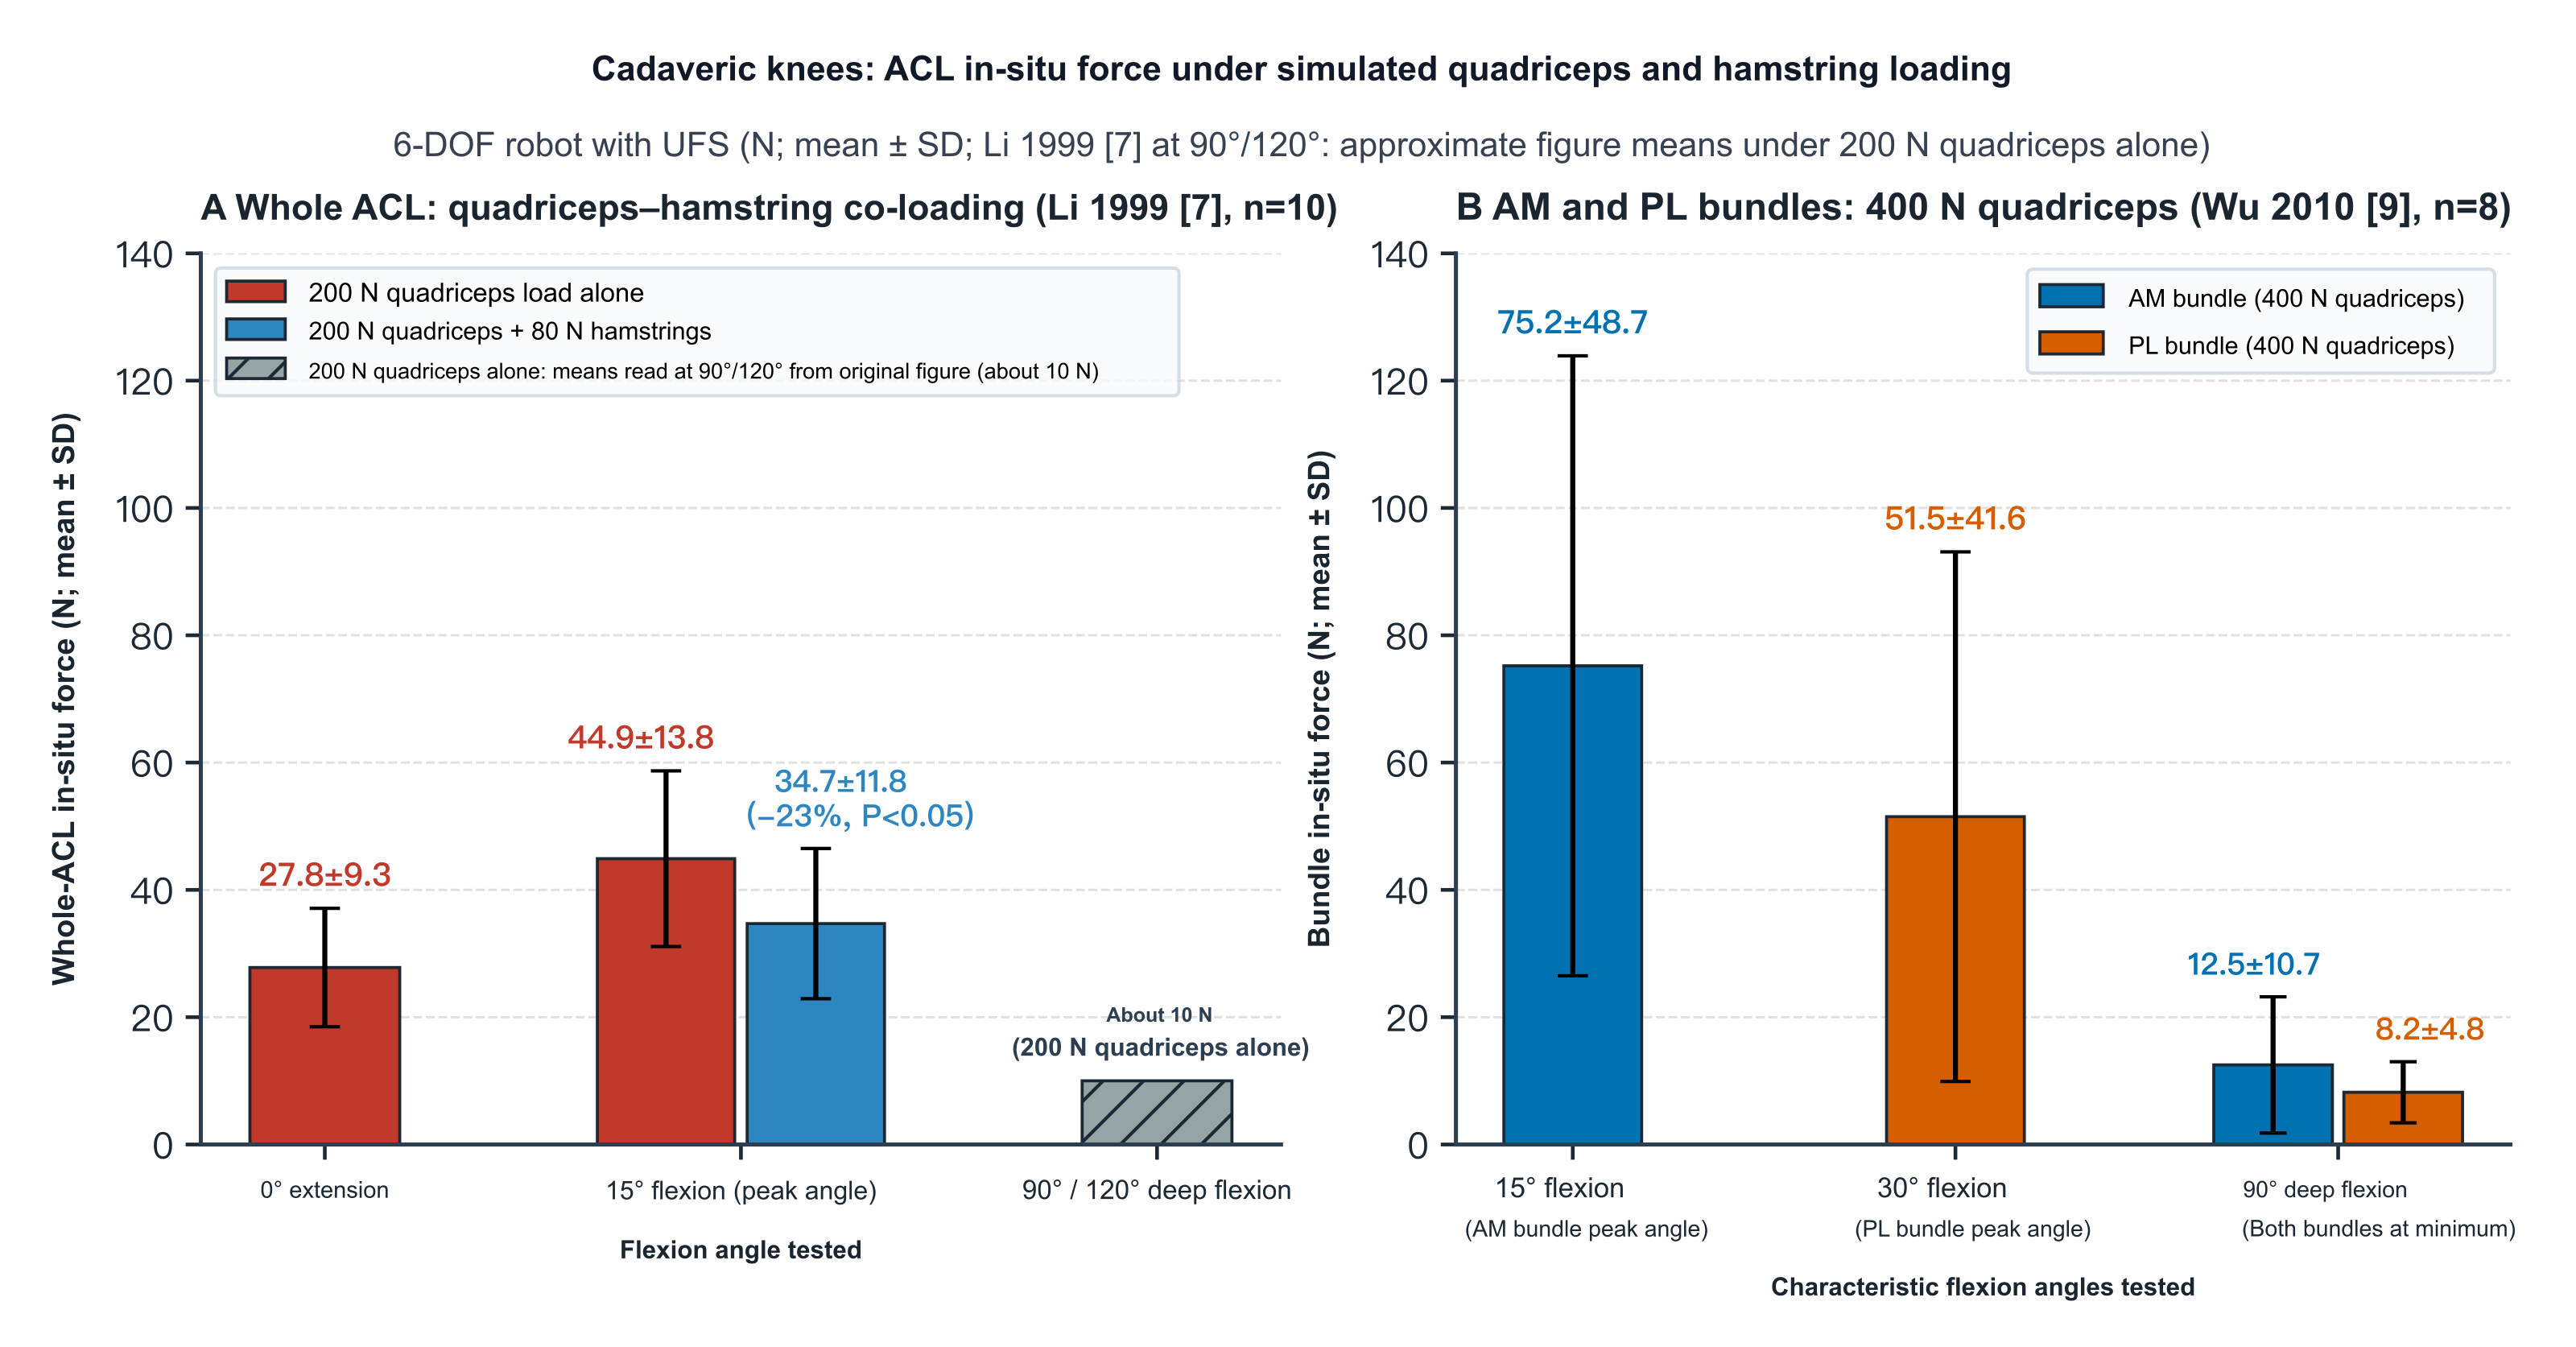
Figure 6. In situ forces in the whole ACL (A) and in the AM and PL bundles (B) of cadaveric knees under simulated quadriceps and hamstring loading (six-degree-of-freedom robot with UFS; N, mean ± SD). A: whole-ACL in situ force from Li et al. 1999[7] (n = 10) under isolated 200 N quadriceps force and under added 80 N hamstring co-contraction (means ± SD at 0° and 15° from the text; approximate mean readings from the original figure at 90° and 120° under isolated 200 N quadriceps). B: magnitudes of the three-dimensional force vectors in the AM and PL bundles from Wu et al. 2010[9] (n = 8) under 400 N quadriceps loading (showing the AM peak at 15°, the PL peak at 30°, and the lowest deep-flexion values at 90°).
In vivo arthroscopic studies under local anesthesia have measured local AM-bundle strain during active contraction in patients with a normal ACL who underwent arthroscopy for meniscal or cartilage lesions. Beynnon et al. (1995) enrolled 11 patients (7 others were excluded for inconsistent repeated drawer curves, and 2 because the sensor could not be implanted)[3]. During seated active flexion–extension from 5° to 90° (n = 9, mean ± SD), local AM-bundle strain peaked at 10° of flexion (2.8% ± 0.6% without weight, rising to 3.8% ± 0.5% with a 45 N ankle weight); the 45 N ankle weight significantly raised strain at 10° and 20°, had no significant effect from 40° to 90°, and shifted the slack–tight transition angle during extension from 35° toward 45°[3]. In isometric tests at fixed angles, a 30 N·m isometric quadriceps contraction (n = 5) produced significant positive strain at 15° (4.4% ± 0.6%) and 30° (2.0% ± 0.5%), while the AM bundle remained unloaded at 60° and 90°, with no significant change from the relaxed control state at the same angles; the AM bundle remained unloaded from 15° to 90° during an isolated −10 N·m isometric hamstring contraction (n = 8); when subjects performed maximal simultaneous isometric co-contraction of the quadriceps and hamstrings (n = 8), there was no significant change from the relaxed state from 30° to 90°, but significant positive strain persisted at 15° of shallow flexion (2.8% ± 0.9%, higher than 0.4% ± 0.5% at 30°)[3]. This shows that near extension at 15°, even maximal voluntary hamstring co-contraction cannot fully offset the stretch imposed on the AM bundle by quadriceps pull through the anteriorly inclined patellar tendon (Table 2 of that paper assembles data from different historical samples across studies, and strain magnitude in the normal ACL alone cannot be used to assert the training safety of a postoperative graft)[3].
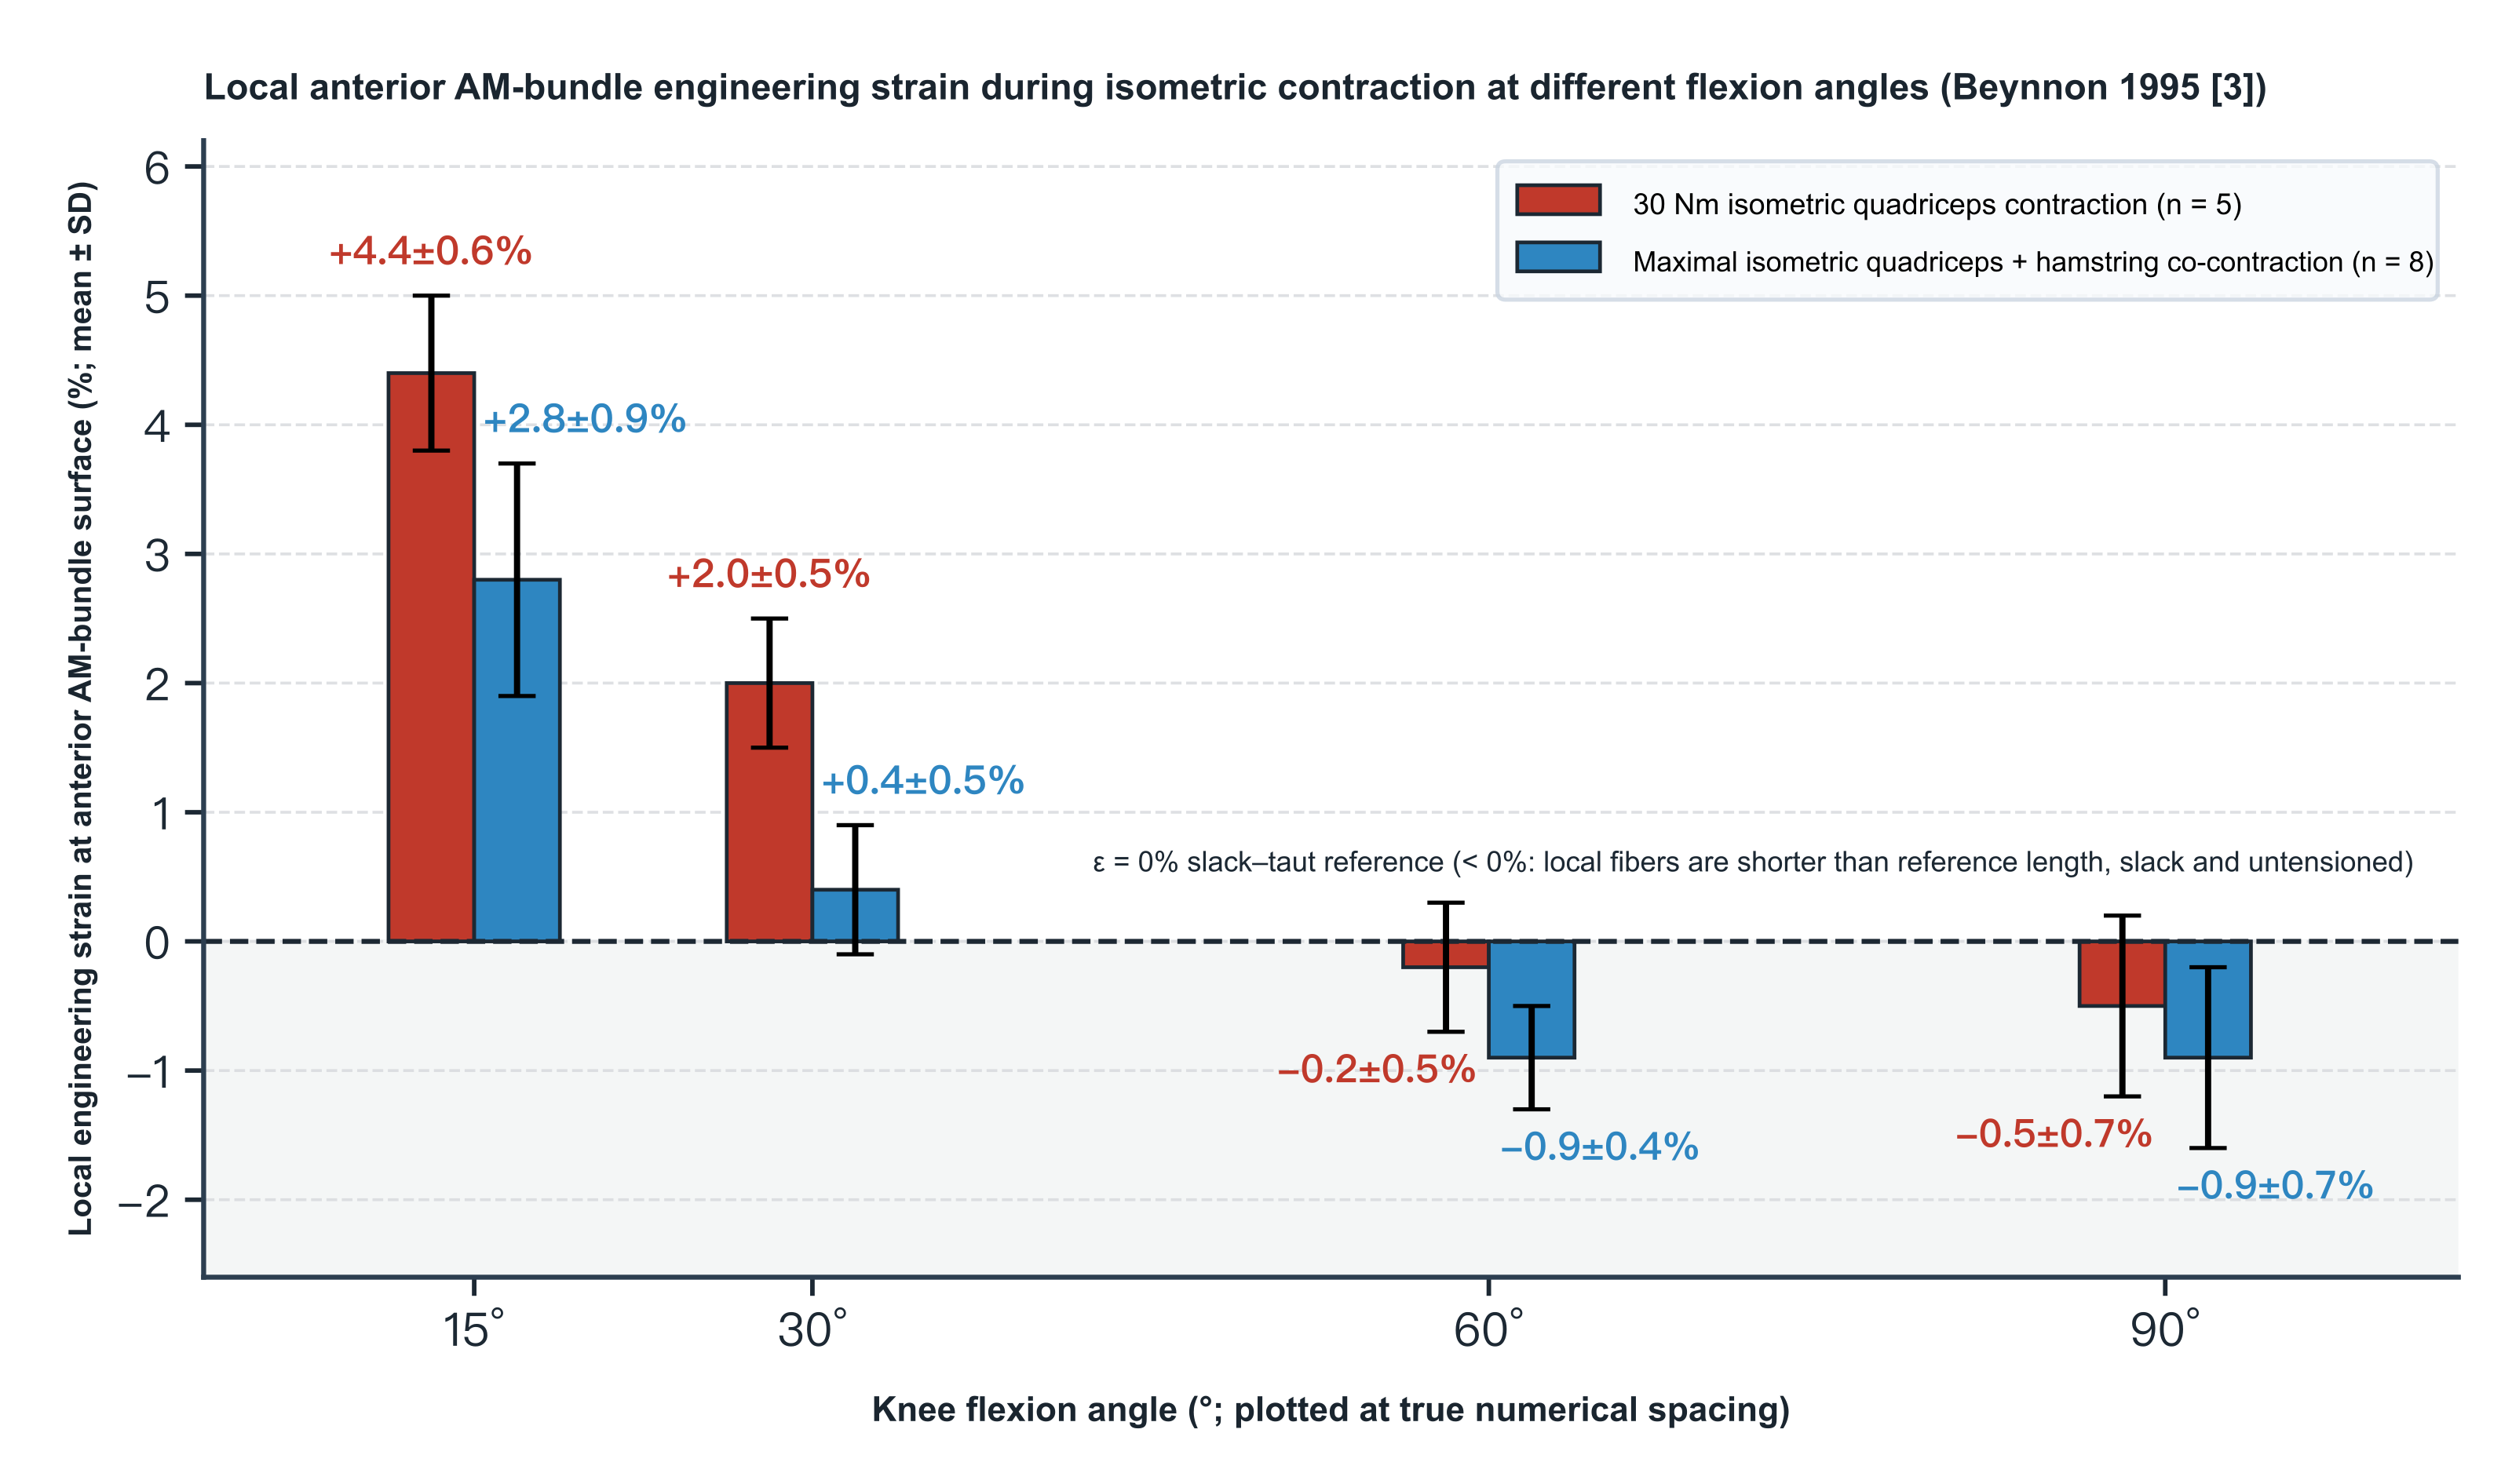
Figure 7. Local engineering strain on the anterior surface of the AM bundle under isometric muscle contraction at different flexion angles (Beynnon et al. 1995[3]; %, mean ± SD). Local engineering strain on the anterior surface of the AM bundle was measured arthroscopically under local anesthesia with a Hall-effect strain transducer (HEST), comparing a 30 N·m isometric quadriceps contraction (n = 5) with maximal voluntary simultaneous isometric co-contraction of the quadriceps and hamstrings (n = 8) at 15°, 30°, 60° and 90° of flexion. The dashed line ε = 0% is the slack–tight reference length l₀ calibrated at 30° of flexion; values < 0% mean that local superficial fibers are shorter than the reference length and are slack and unloaded in tension; they do not represent the PL bundle or the resultant force in the whole ACL.
Addressing the open- versus closed-chain rehabilitation debate, Beynnon et al. (1997) compared seated active flexion–extension (open chain), bilateral squatting (closed chain) and bilateral squatting with additional elastic-cord resistance in 8 patients under local anesthesia[6]. Mean peak local AM-bundle strain (mean ± SD) for all three exercises occurred near extension at 10°: 3.8% ± 1.0% for active flexion–extension, 3.6% ± 1.3% for squatting without cord, and 4.0% ± 1.7% for squatting with elastic cord, thereafter decreasing with deeper flexion to 90°[6]. No significant differences among the three exercises were detected at 10°, 20°, 70° or 90° of flexion (P ≥ 0.29), but at 30° and 50° of mid-flexion both forms of bilateral squatting produced significantly higher local AM-bundle strain than seated active flexion–extension (P = 0.01, still below each exercise's own peak near 10°), and whether the squat included an elastic cord made no significant difference at any angle[6]. The experiment did not record electromyography (EMG) or measure joint-surface compressive force; a postoperative graft differs from the native ACL in tunnel position, initial fixation stiffness and collagen remodeling, and the absence of a detectable peak difference in 8 patients with a normal ACL does not mean that the two exercises carry equal risk of permanent deformation or injury to a postoperative graft[6].
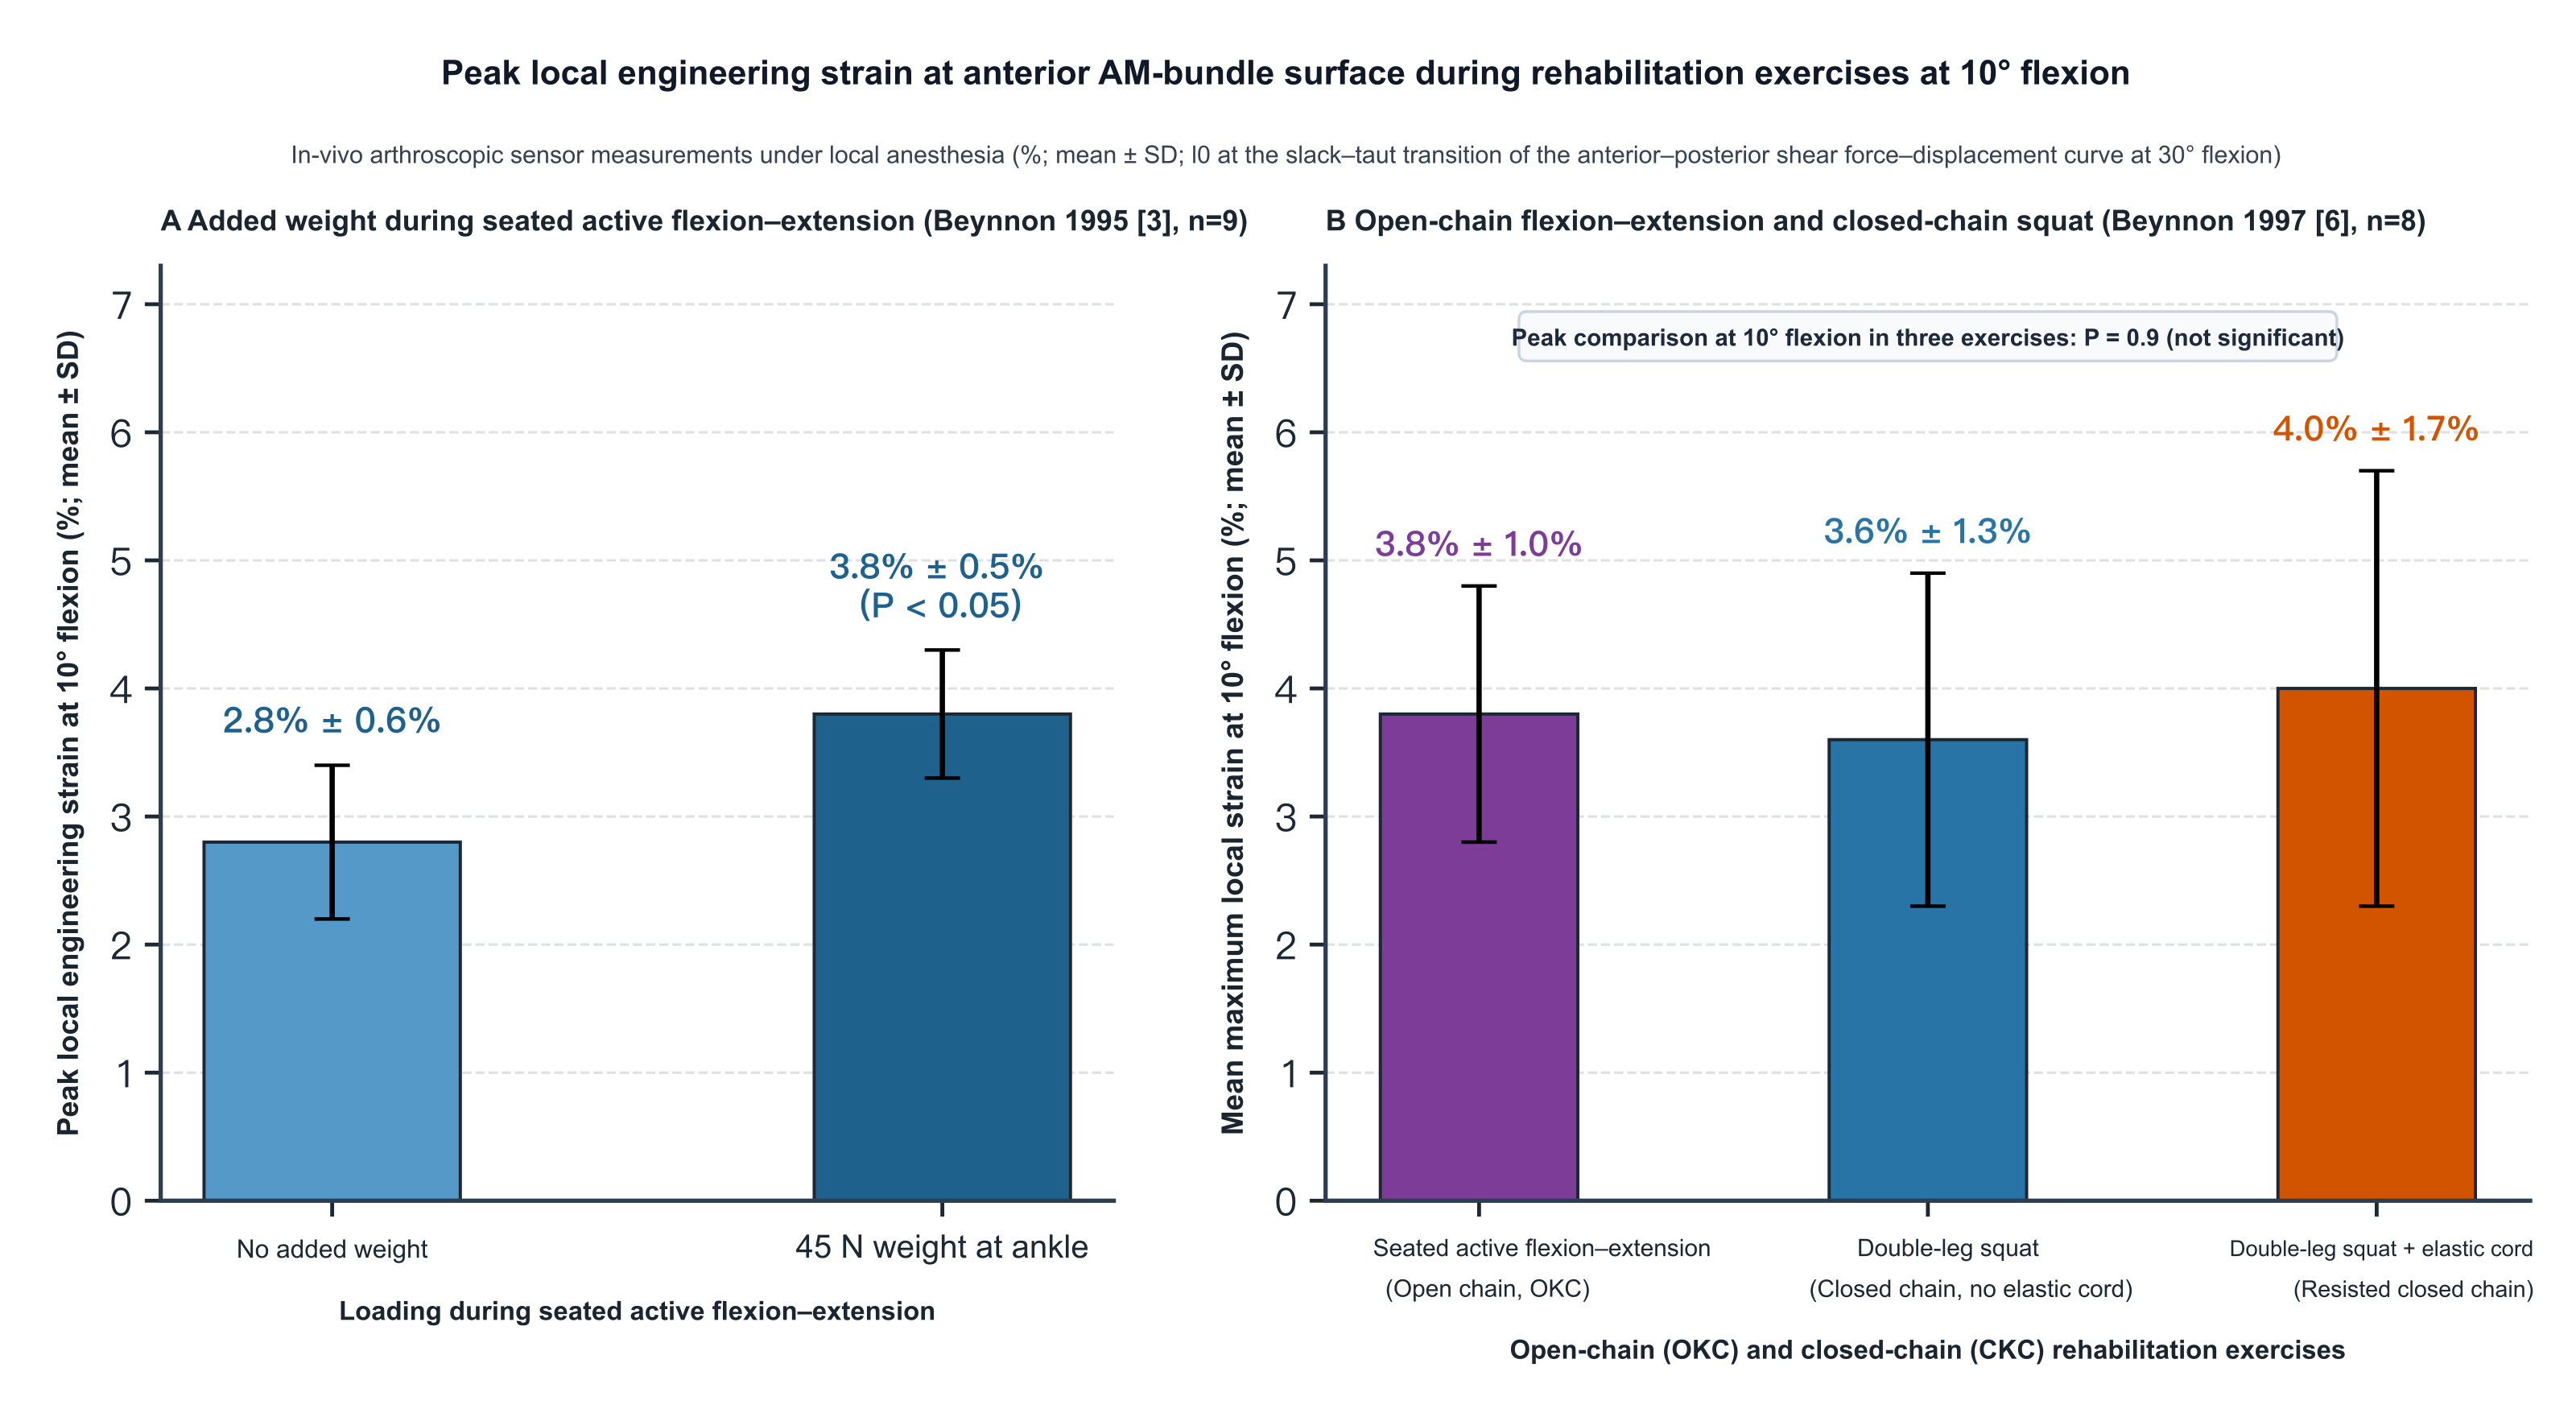
Figure 8. Peak local engineering strain on the anterior surface of the AM bundle at 10° of flexion during rehabilitation exercises (in vivo arthroscopic local strain transducers under local anesthesia; %, mean ± SD). Both experiments calibrated the slack–tight reference length l₀ at 30° of flexion. A: Beynnon et al. 1995[3] (n = 9, HEST) comparing peak local strain at 10° during seated active flexion–extension without external weight and with a 45 N ankle weight. B: Beynnon et al. 1997[6] (n = 8, DVRT) comparing seated active flexion–extension (open chain), bilateral squatting (closed chain without elastic cord) and bilateral squatting with elastic-cord resistance (closed chain with resistance) at 10° of flexion.
Under joint loading, Fleming et al. (2001; supported by djOrthopaedics) fixed 11 patients under local anesthesia at 20° of flexion and applied an axial load of 40% of body weight along the ankle-to-hip line with a loading frame; because the thigh was not fixed, subjects had to contract the lower-limb muscles actively to maintain 20° of flexion, so what was measured was the combined state of "40% body-weight axial load plus active muscular maintenance"[10]. Results (mean ± half-width of the 95% confidence interval) showed that, without applied shear or moment, switching from non-weightbearing to frame weightbearing significantly raised local AM-bundle strain at 20° of flexion from −2.0% ± 1.78% to 2.1% ± 1.78% (P < 0.01)[10]. With superimposed anteroposterior shear, local AM-bundle strain under weightbearing was significantly higher than under non-weightbearing across the full range of posterior shear and for anterior shear <40 N (P < 0.01), and the two conditions converged at higher anterior shear of 40–130 N (P = 0.74 at 130 N)[10]. With superimposed axial rotation moments, weightbearing (2.4% ± 1.97%) and non-weightbearing (2.4% ± 1.72%) did not differ significantly under −9 N·m of internal rotation (P = 0.82), whereas from −2 N·m of low internal rotation through +9 N·m of external rotation strain was significantly higher under weightbearing (P = 0.02)[10]. With superimposed ±10 N·m varus–valgus moments, the AM bundle remained unloaded throughout under non-weightbearing and was significantly loaded throughout under weightbearing (P < 0.01)[10]. Thus at 20° of shallow flexion, 40% body-weight axial load with active muscular maintenance clearly raises local AM-bundle strain; the authors proposed anterior shear from posterior tibial slope under articular compression and active contraction of the knee extensors as two possible causes, but the experiment did not separately manipulate slope, axial compression and muscle force and cannot yet quantify their individual contributions[10].
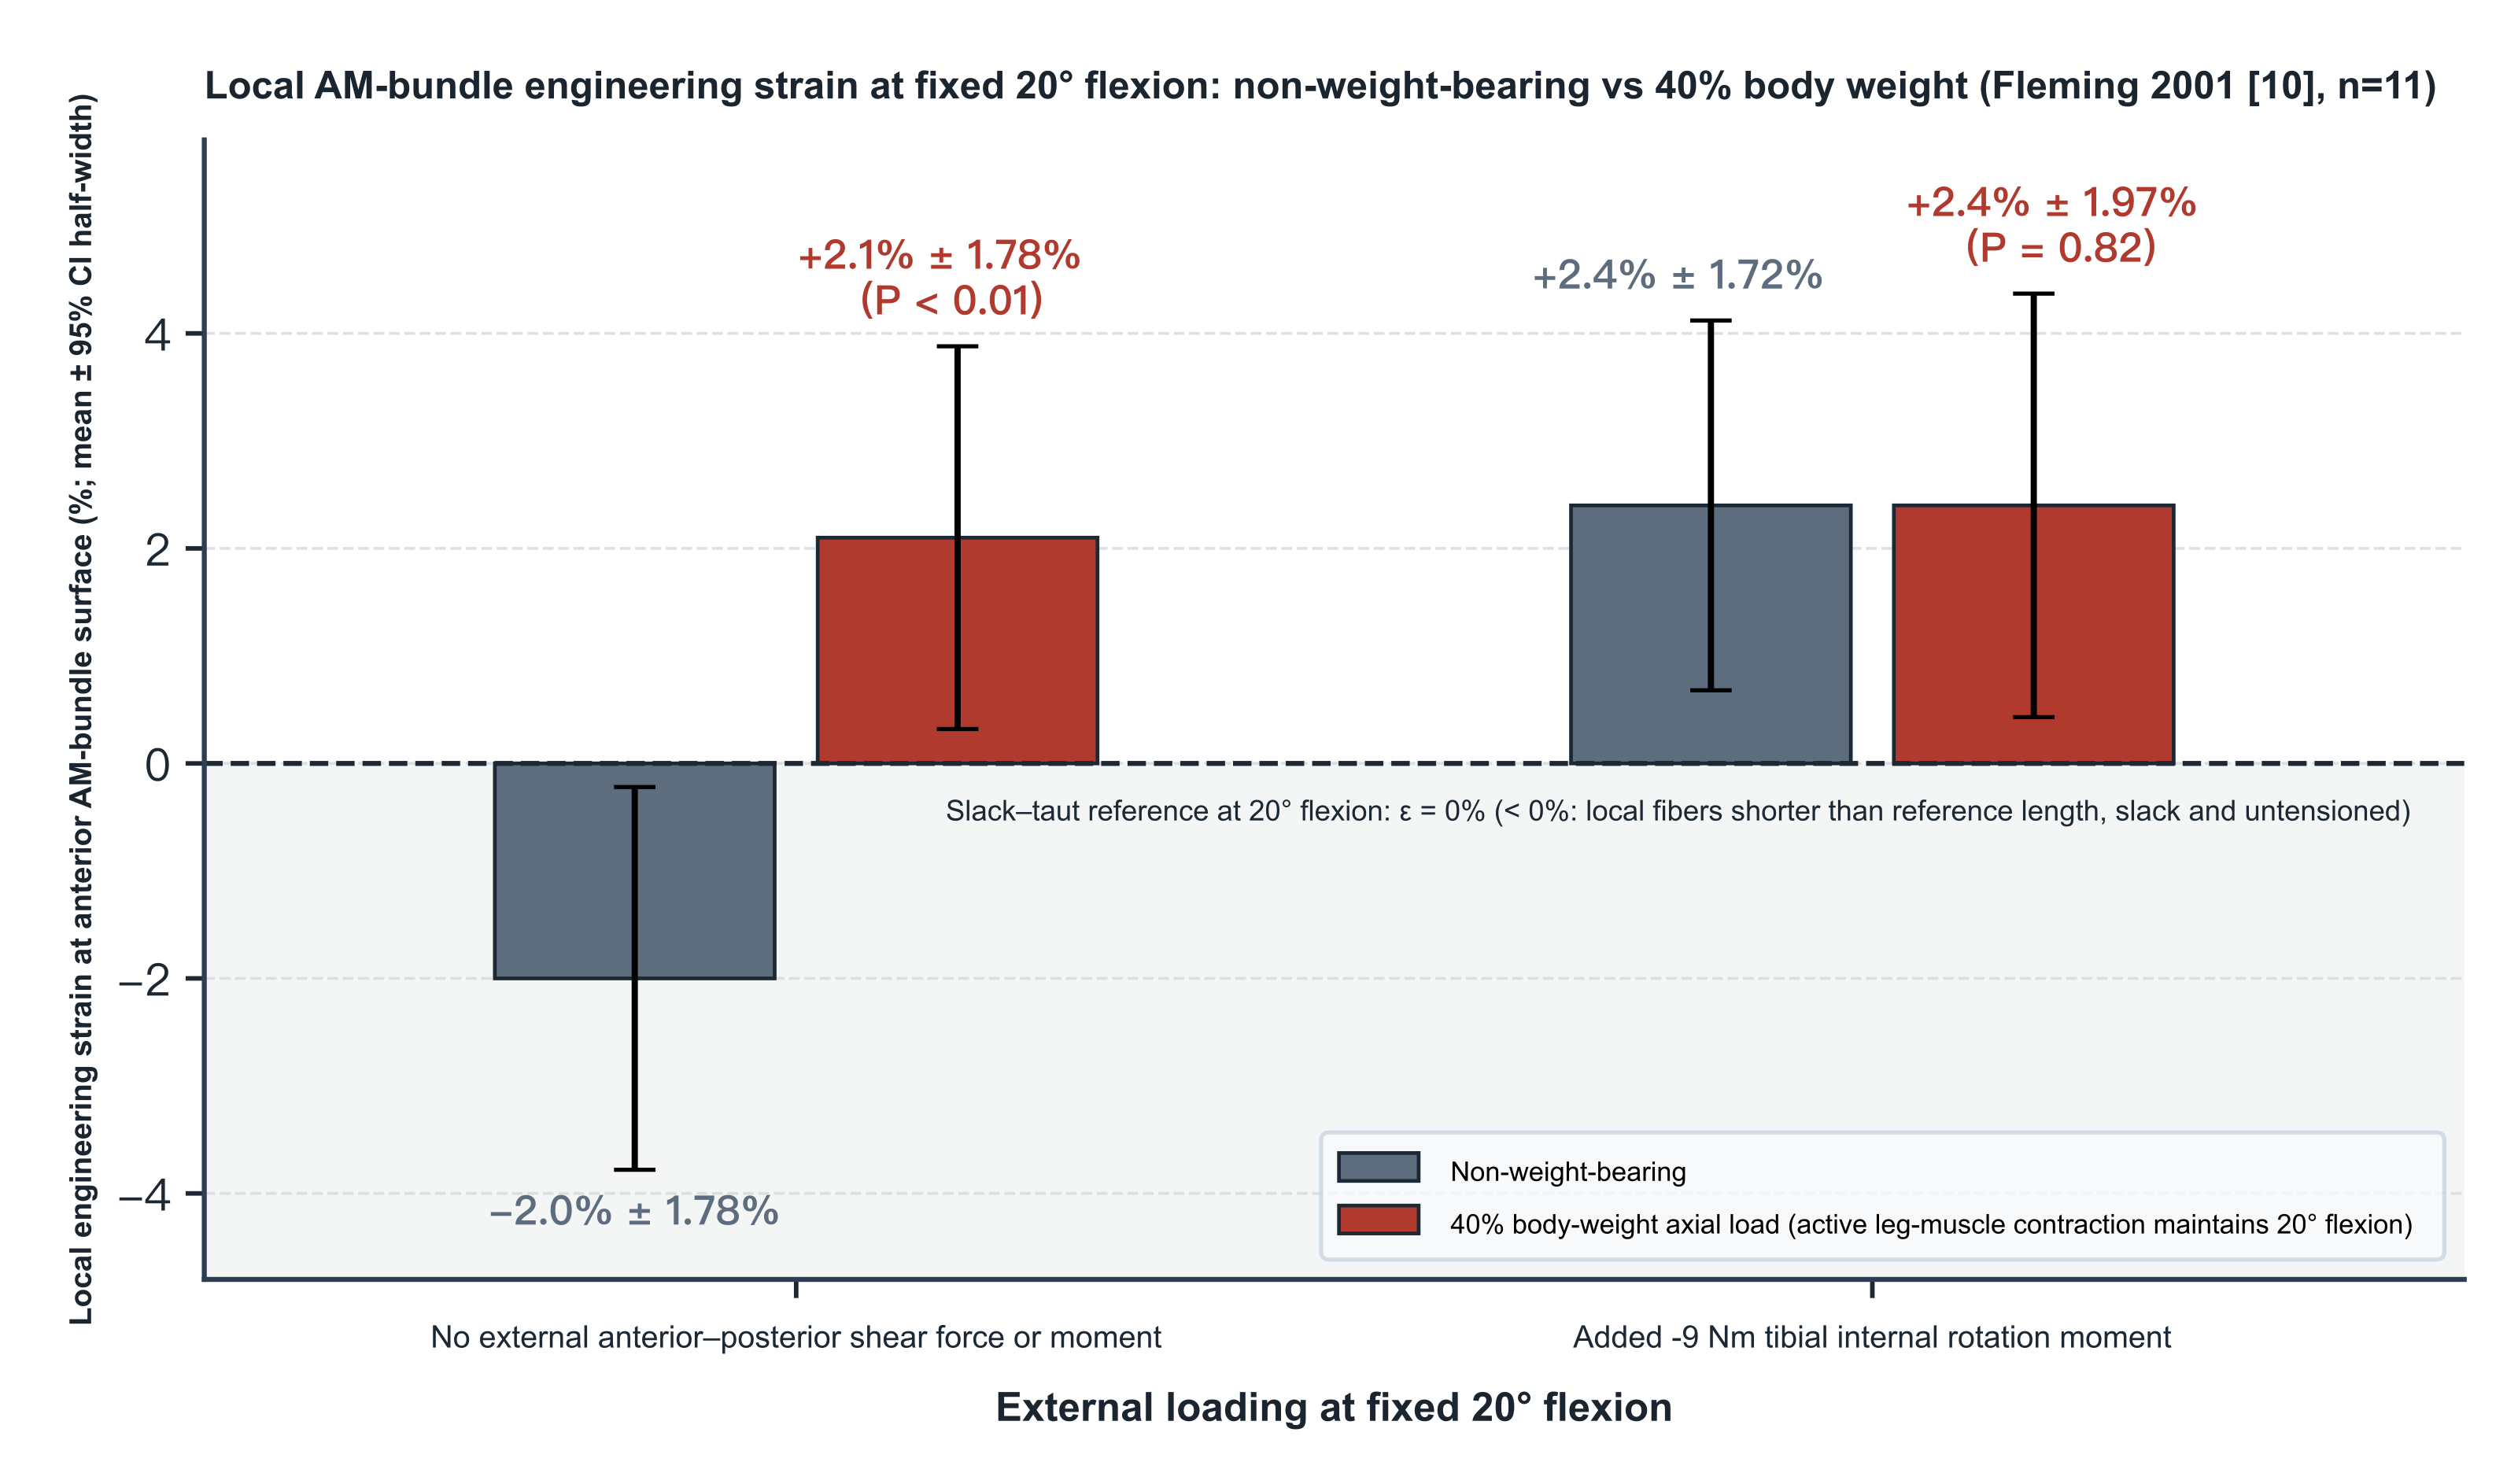
Figure 9. Local engineering strain on the anterior surface of the AM bundle at a fixed 20° of flexion under non-weightbearing and under 40% body-weight loading (Fleming et al. 2001[10], n = 11; %, mean ± half-width of the 95% confidence interval). Local strain was measured arthroscopically under local anesthesia with a DVRT, comparing non-weightbearing and 40% body-weight axial loading with and without a superimposed −9 N·m tibial internal-rotation moment (subjects had to contract the lower-limb muscles actively to maintain 20° of flexion). The dashed line ε = 0% is the slack–tight reference length l₀ calibrated at 20° of flexion; values < 0% mean that local superficial fibers are shorter than the reference length and are slack and unloaded in tension; they do not represent the PL bundle or the resultant force in the whole ACL.
4. In Vivo Relative Elongation of Attachment-Site Distances During Walking, Running, and Jump Landing
Noninvasive in vivo three-dimensional dynamic studies have shown how the center-to-center distance between ACL attachments changes relative to a static scanning posture during daily gait and during running and jump landing. Nagai et al. used CT bone-model matching with biplane radiography to measure relative elongation of the two bundles in the right knees of 10 healthy subjects during self-selected walking (1.4 ± 0.2 m/s) and jogging (2.6 ± 0.4 m/s), taking as l₀ the center-to-center distances of a 50/50 geometric division at the midpoint of the attachment axis on supine full-extension MRI[14]. Results (mean ± 95% CI) showed that relative-elongation peaks for both activities occurred in stance: during walking the AM peak was 5.0% ± 1.7% (flexion 11.3° ± 12.3°) and the PL peak 3.4% ± 2.3% (flexion 2.6° ± 2.9°; between-bundle P = 0.157); during jogging the AM peak rose to 6.7% ± 2.1% (flexion 29.5° ± 6.4°, higher than walking, P = 0.043) and the PL peak fell to 1.1% ± 2.1% (flexion 26.4° ± 7.5°, lower than walking, P = 0.014; between-bundle difference during jogging P < 0.001)[14]. The authors noted that the larger stance flexion angle during jogging may partly explain the reduced relative elongation of the PL bundle, and acknowledged that without the slack–tight transition length of each bundle, relative distance percentages cannot determine absolute elongation of the two bundles or the force share each actually carries[14]. Figs. 4 and 5 of the original show that the same flexion angle corresponds to different bundle lengths in stance and swing; however, the multiple stepwise regressions in Tables 1 and 2 (R² = 0.925–0.986) fit group-mean interpolated time-series points directly without reporting treatment of temporal autocorrelation and cannot serve as independent individual predictors, and in Table 1 the walking AM-bundle swing-phase row for "lateral–medial tibial translation" has B = −1.403 and β = +0.977 with opposite signs, while Supplemental Figs. S-1 and S-2 show that changing the division ratio (30/70 to 70/30) markedly alters the amplitude of the swing-phase curves[14].
Englander et al. (2020), using MRI bone models and biplane radiography in 10 healthy subjects walking on a treadmill at 1 m/s (l₀ = attachment-region center-to-center distance on supine MRI at a mean flexion of 8° ± 2°), found that relative elongation of the whole ACL (mean ± SD) was bimodal over the gait cycle: a local peak of 5% ± 4% in mid-stance (flexion −2° ± 8°) and a cycle-wide maximum of 12% ± 5% about heel strike (flexion −4° ± 10°)[15]. On the group-mean time series at 2% cycle intervals (temporal autocorrelation not reported), Spearman correlation showed strong negative associations between flexion angle and relative elongation of the whole ACL (ρ = −0.87), AM bundle (ρ = −0.86) and PL bundle (ρ = −0.82), and a strong positive association between the two bundles (ρ = 0.90; all P < 0.001)[15]. Addressing the report of a "12% peak strain" during level walking, Bates et al. wrote that supine MRI does not determine the zero-strain length at which the ligament tightens and that 12% cannot be treated as true tissue tensile strain[16]; yet Bates et al. not only misquoted the original 12% as 12.5%, but also added an approximately 3% strain increment from cadaveric impact testing to obtain 15.5% and placed it beside the failure strain from cadaveric ACL tensile tests (15.0% ± 1.4%), confounding measures referred to different reference baselines[16]. Englander et al. replied that the original never reported 12.5%, and that normalizing a single subject to a fixed positive l₀ does not change the timing or posture at which that subject's own maximum length occurs[17]; but the reply's claim that changing the reference length "does not change any of the study's conclusions" is too absolute—when the true unloaded length has not been measured, differences among subjects in initial slack or pretension still alter the magnitude of each person's percentage, the group mean and pooled cross-subject relationships[15,16,17].
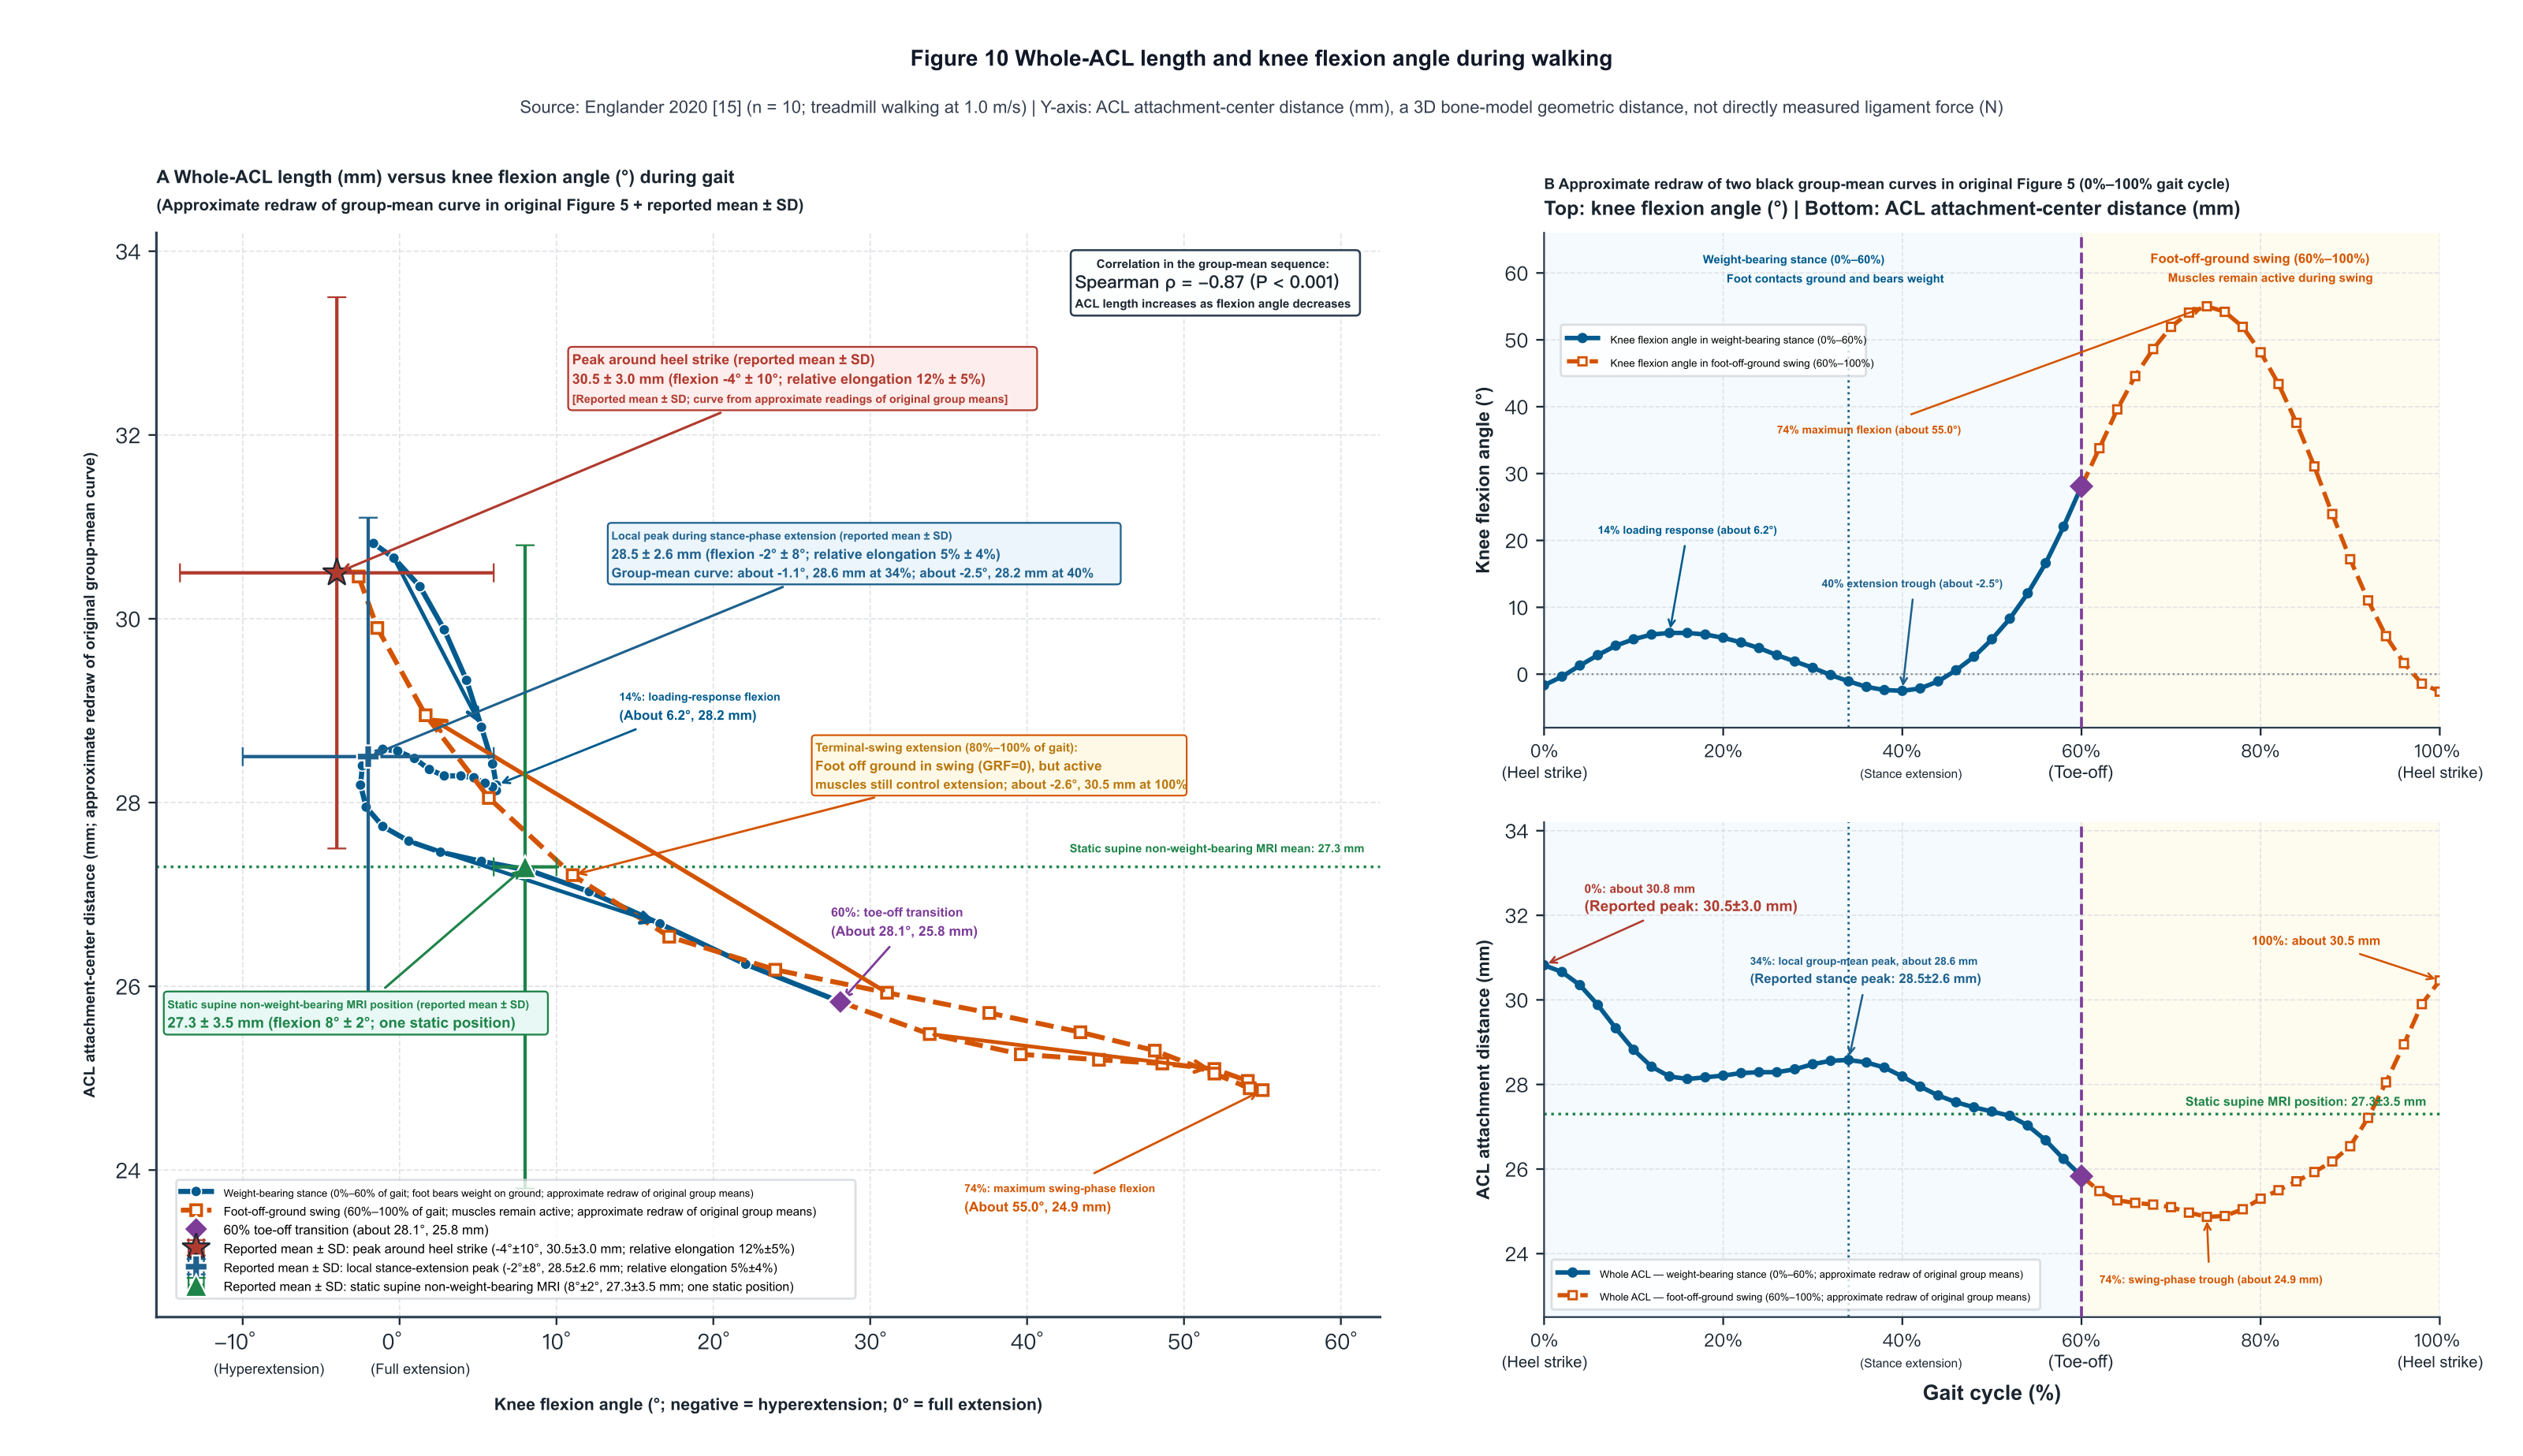
Figure 10. Relationship between whole-ACL length and knee flexion angle during walking (Englander et al. 2020[15], n = 10, walking at 1.0 m/s). The ordinate is the attachment-region center-to-center distance of the whole ACL (mm) measured by biplane radiography registered to three-dimensional MRI bone models, not directly measured ligament force (N). A: gait trajectory of ACL length versus flexion angle. B: paired trajectories of flexion angle (above) and ACL length (below) over 0%–100% of the gait cycle. Curves are approximate readings of the group means in original Fig. 5, distinguishing 0%–60% weightbearing stance from 60%–100% swing after toe-off (active muscle activity continues in swing); symbols with error bars are means ± SD reported in the original (peak about heel strike 30.5 ± 3.0 mm, −4° ± 10°; stance-extension peak 28.5 ± 2.6 mm, −2° ± 8°; single supine static MRI posture 27.3 ± 3.5 mm, 8° ± 2°).
In a jumping task, Taylor et al. combined skin-marker motion capture, static biplane radiography and supine MRI (mean flexion 16.6° ± 6.2°) to measure 8 healthy men landing from a 47 cm platform with both feet and immediately performing a maximal vertical jump[11]. Results (mean ± 95% CI) showed that subjects actively extended from 48.9° ± 14.7° over 302 ± 51 ms during flight in preparation for landing, and reached a peak whole-ACL relative elongation of 12% ± 7% at 55 ± 14 ms before initial contact, near the minimum flexion angle (11.2° ± 3.5°), whereas the local peak after contact was 5% lower than the pre-contact maximum elongation[11]. The study, however, verified skin-marker registration accuracy only in 4 subjects during quasistatic lunges from 0° to 45° (R² = 0.92, root-mean-square error 0.5 mm), could not directly verify soft-tissue artifact during high-speed landing impact, did not record EMG, and in the Discussion compared the 12% relative elongation directly with cadaveric ACL tensile failure strains (15%–19%), again confounding different reference zeros[11].
Englander et al. (2021) used biplane radiography to track bone and patellar-tendon motion directly in 8 healthy men during a single-leg vertical jump in place: a local peak of the group-mean ACL relative-elongation curve occurred near 40% of the jump cycle (during the flight extension phase 61 ± 42 ms before initial contact), at which flexion was −2° ± 8° and the sagittal patellar-tendon angle rose to 18° ± 6°, ACL relative elongation reached 7% ± 4%, patellar-tendon relative elongation rose synchronously to 7% ± 3%, and both group-mean curves rose again from contact to peak ground-reaction force[18]. In bivariate linear regressions at 14 group-mean time points (original Fig. 6; temporal autocorrelation not reported), flexion angle was strongly negatively associated with sagittal patellar-tendon angle (r² = 0.95, P = 3.4 × 10⁻⁹), and ACL relative elongation was positively associated with patellar-tendon relative elongation (r² = 0.65, P = 4.8 × 10⁻⁴), supporting lengthening of the ACL near extension by quadriceps tension through the anteriorly inclined patellar tendon (although EMG and muscle force were not measured directly)[18]. In the multivariable regression with robust variance estimation in Table 1 of that paper (p. 6), however, the "flexion angle" row has Estimate = −0.2, SE = 0.2 and t = −3.4 (P = 0.0008), which are mathematically incompatible (even allowing one-decimal rounding, |Estimate / SE| is at most about 1.67); that row's parameter estimates cannot be used quantitatively[18].
On associations with coronal posture and bony morphology, Foody et al. (2023)[19] and (2024)[20] both reported biplane radiographic data from 17 healthy subjects performing a single-leg vertical jump in place; the two papers have identical demographics and side distributions, and the 2024 recruitment methods cite the 2023 study directly, so they very likely share the same subject cohort and cannot be treated as independent population replications. The 2023 study expressed dynamic joint angles as changes relative to each subject's supine MRI posture and observed local peaks of group-mean ACL relative elongation near takeoff (relative flexion −6.5° ± 8.6°) and mid-flight (relative flexion −2.4° ± 12.3°); on a 1%-interpolated group-mean time series (temporal autocorrelation not reported), Spearman correlation showed a negative association between flexion angle and ACL relative elongation (ρ = −0.3, P = 0.002) and no detected association between varus–valgus angle and ACL relative elongation (ρ = −0.01, P = 0.9)[19]. Throughout that task subjects' mean varus–valgus position was −0.5° ± 0.3° and mean coronal excursion only 0.8° ± 0.3° (peak across-subject SD 1.3°–1.4°) without an applied valgus perturbation; the small coronal range of motion limits inference from these data about injury conditions involving large valgus or valgus moments[19].
Foody et al. (2024) had two raters measure medial posterior tibial slope (3.3° ± 2.9°), lateral posterior tibial slope (4.1° ± 5.1°) and medial plateau depth (2.1 ± 0.6 mm; interrater ICCs 0.59, 0.85 and 0.94, respectively) on MRI, and found no significant association between maximal ACL relative elongation over the whole jump in the 17 subjects and any of the three bony-morphology measures (all P > 0.46)[20]. This negative result cannot exclude smaller morphologic associations or clinical injury risk: sample-size estimation in that paper was split into two parts—the sample of 17 was powered (prior walking peak relative-elongation SD 5%; α = 0.05, 80% power) to detect a nonzero ACL peak relative elongation ≥3.6% (that is, a difference of the peak relative elongation from 0), whereas the bony-morphology correlation analysis was powered for a strong correlation (r = 0.76, at least 11 subjects); the dependent variable was maximal relative elongation over the whole jump (often occurring in flight), without separately isolating the post-landing axial-compression phase, and the experiment itself did not observe injury outcomes[20]. In addition, the authors multiplied each subject's l₀ by a random factor drawn from N(1, 0.05²) and repeated the simulation 100 times in Table 3 (yielding 4, 2 and 1 instances of P < 0.05 for the three measures), and in the text (p. 6) interpreted α = 0.05 as meaning that "at most 5" significances in 100 simulations could be attributed to random error; that interpretation confuses the long-run expected false-positive rate under independent sampling with an upper bound on the number of times significance appears when the same sample is repeatedly noise-perturbed, and a random proportional perturbation with mean 1 cannot test systematic bias in the supine MRI reference length[20].
Focusing on the post-contact impact-braking phase, Kamada et al. used CT bone models and biplane radiography to measure relative elongation of the two bundles in 19 healthy college athletes (38 knees bilaterally) during fast running at 5.0 m/s and single-leg drop landing from 20 cm (senior author V. Musahl disclosed consulting fees from Newclip and Smith & Nephew, equity in Ostesys, and University of Pittsburgh patent US 9,949,684)[21]. Dynamic analysis in that paper was limited to the post-contact interval and did not report flight-phase results; running was analyzed over the first 60% of stance, and drop landing from initial contact (0%) to peak flexion (100%); l₀ was the center-to-center distance of a 50/50 geometric division at the attachment midpoints in the supine CT posture (measured mean flexion 6.5° ± 3.5°), and dynamic flexion angles were zeroed by subtracting each knee's CT flexion angle[21]. Generalized estimating equation results (mean [95% CI], Table 2) showed that over the first 60% of running stance AM-bundle peak relative elongation was 4.3% (1.9%–6.7%, relative CT flexion 29° [27°–31°]), significantly higher than the PL peak of 1.7% (−1.3%–4.7%, relative CT flexion 27° [25°–30°], P < 0.001), consistent with Nagai et al.'s observation of greater AM relative elongation during jogging[14,21]. During 20 cm single-leg drop landing, the PL bundle reached its peak first within the initial 20% of the analysis interval at 7.6% (5.2%–10.1%, relative CT flexion 8° [5°–12°], anterior tibial translation 3.1 mm, internal rotation 8.2°), and the AM bundle peaked near 40% of the analysis interval at 6.7% (4.7%–8.7%, relative CT flexion 14° [11°–18°], anterior translation 4.0 mm, internal rotation 10.9°); peak relative elongations of the two bundles did not differ significantly (P = 0.17), but the kinematic differences at the peaks were all P < 0.001, showing that both bundles successively reach large attachment-site relative distances early in contact braking[21].
Kamada et al.'s original, however, has four clear reporting and inference problems[21]. The Results text (p. 6) misstates the drop-landing AM peak as "7.6% (95% CI, 4.7%–8.7%)," splicing the PL point estimate from Table 2 with the AM confidence interval; the Discussion (p. 7) further claims that during running the PL bundle never exceeded CT length and that maximal AM elongation was "about 2%," which conflicts with Table 2 (1.7% and 4.3%) and Fig. 3[21]. The Methods (p. 3) state that 3 trials per side were collected for analysis from 38 knees (which should be 114), yet the Results (p. 5) report 57 running trials and 114 drop-landing trials without explaining why running trials were halved[21]. On clinical inference, the Discussion (p. 8) recommends from the drop-landing peak angles that during ACL reconstruction the AM bundle be fixed at about 14° of flexion and the PL bundle at a slightly smaller flexion angle, both with the tibia in slight internal rotation; that recommendation has neither graft-mechanical nor clinical follow-up support, and overlooks that the 14° and 8° in Table 2 are relative angles after subtraction of each subject's supine CT flexion (mean 6.5° ± 3.5°) and cannot be taken directly as absolute flexion angles on the operating table[21].
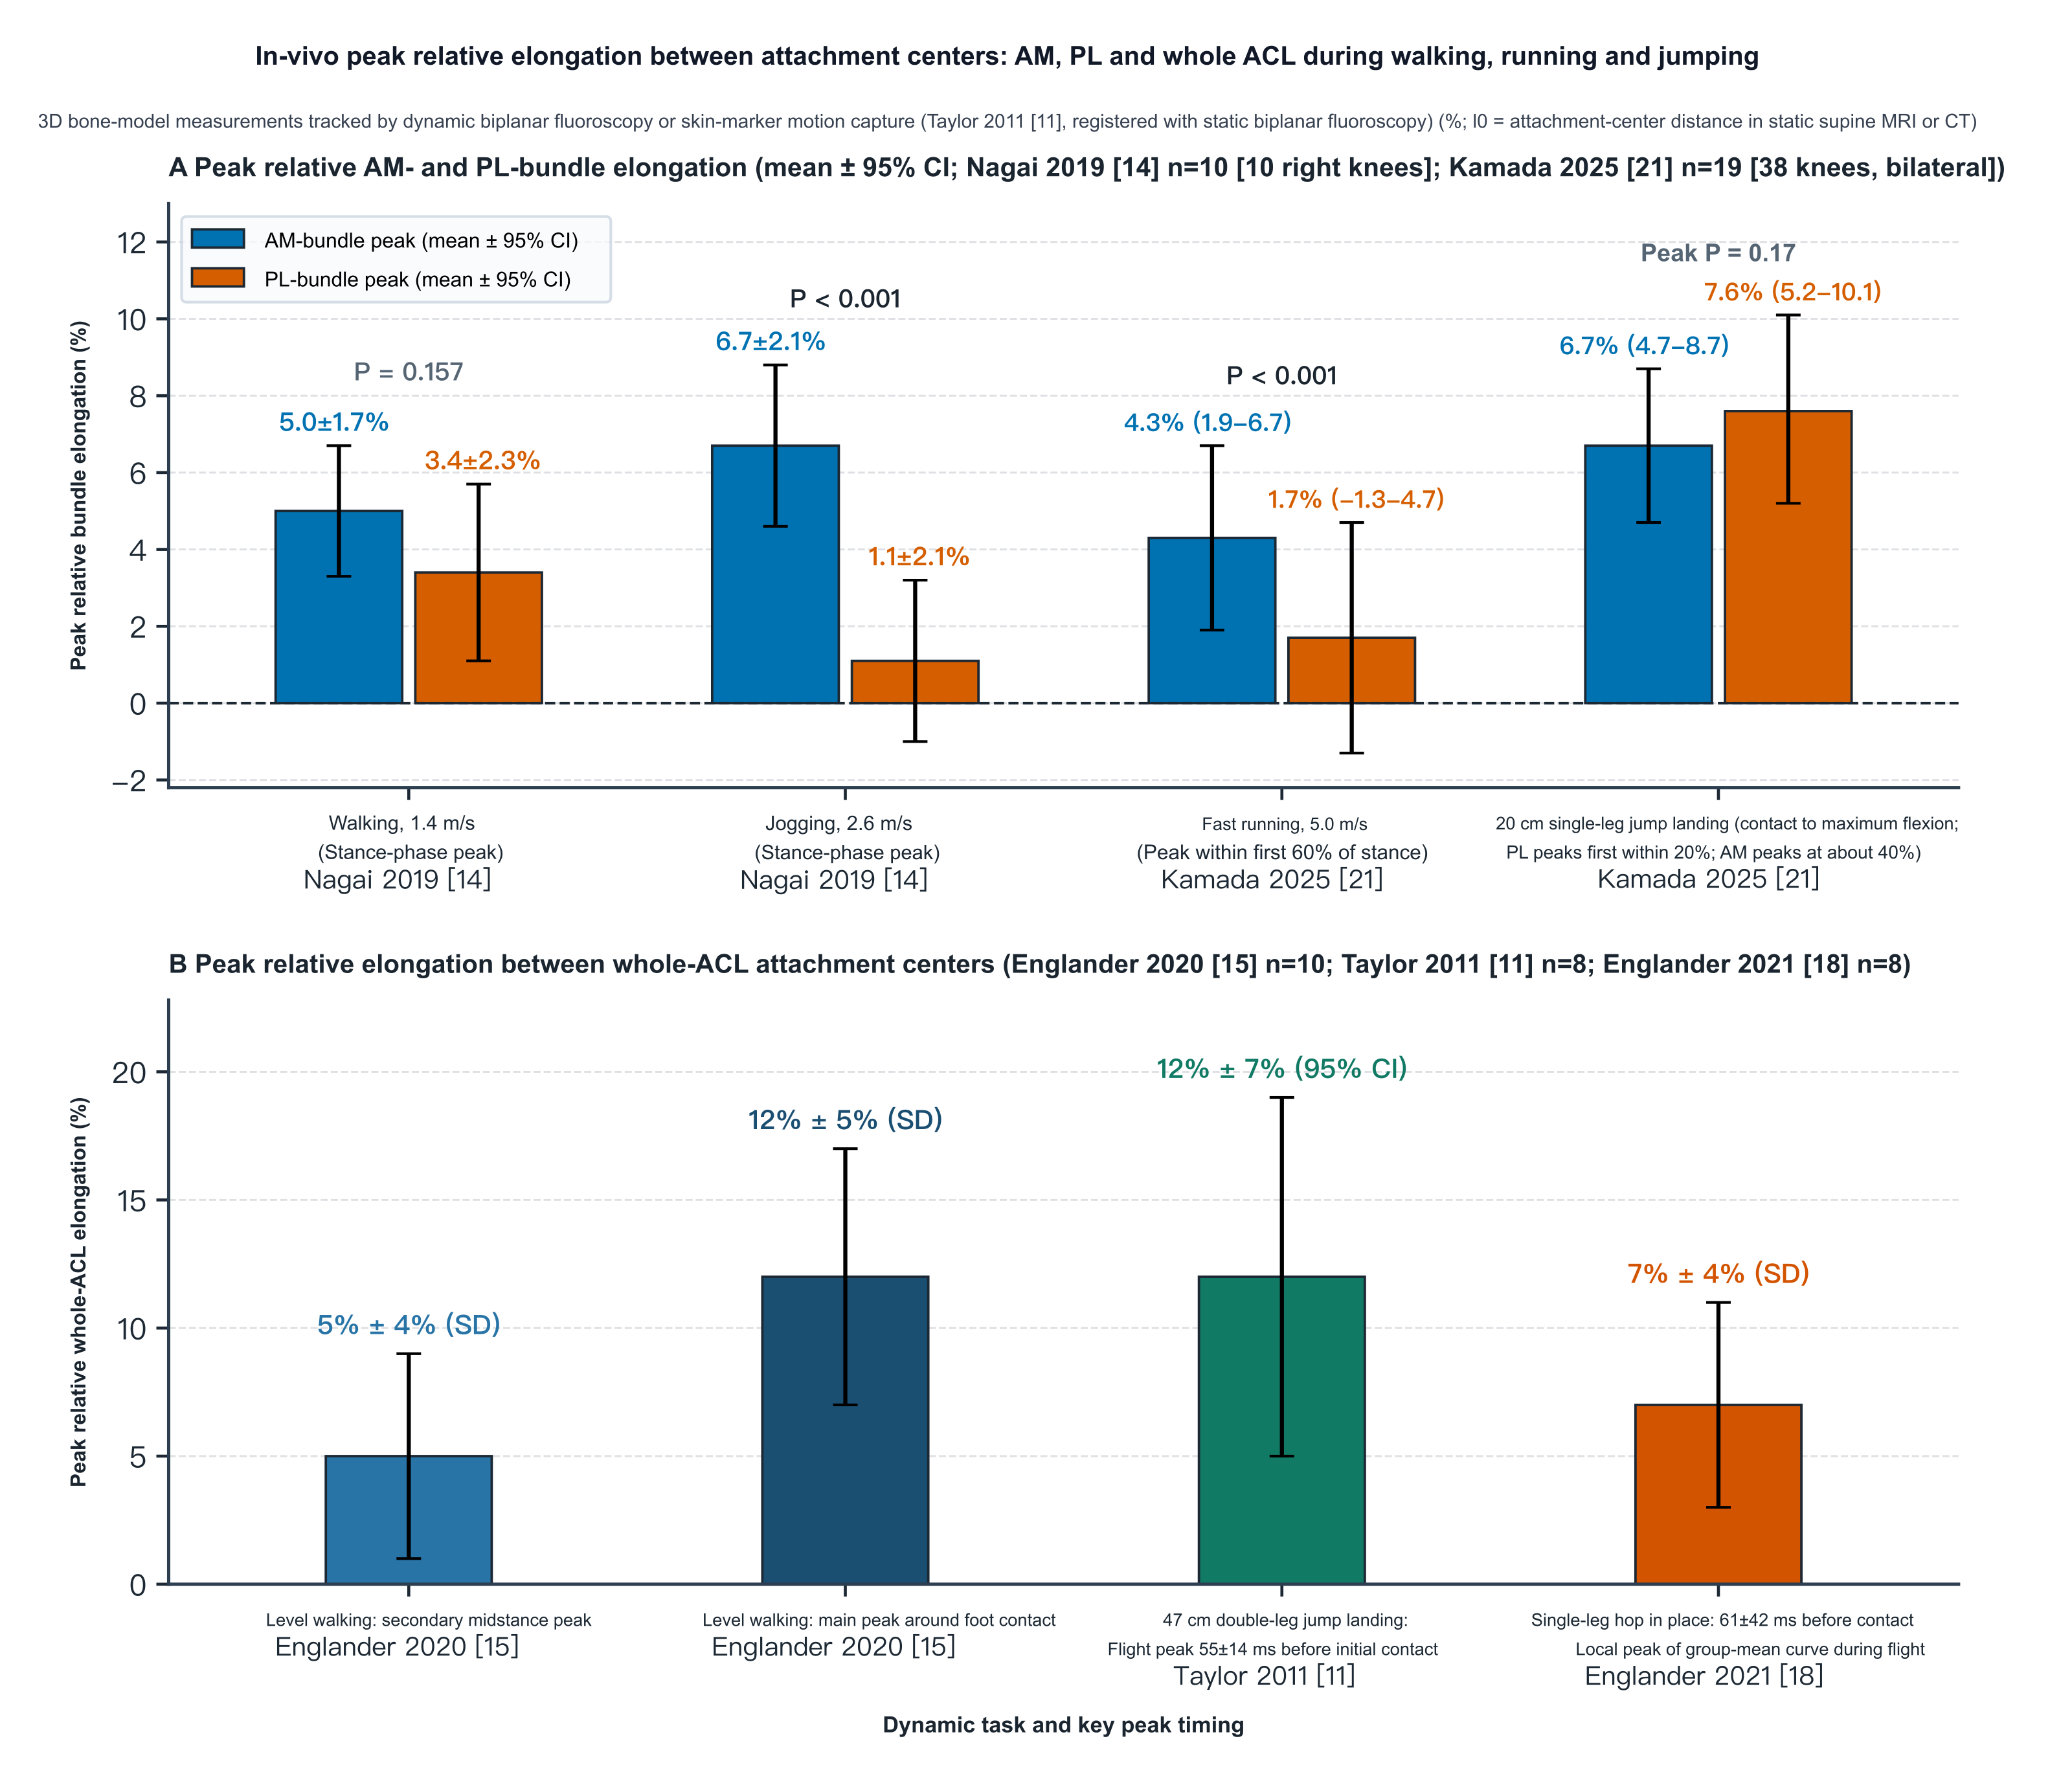
Figure 11. Peak in vivo relative elongation of attachment-site center-to-center distances for the AM and PL bundles (A) and the whole ACL (B) during walking, running and jumping tasks (%). Percentage change in attachment-site center-to-center distance relative to a static supine scanning posture (l₀), measured by three-dimensional CT or MRI bone models registered to biplane radiography (Taylor et al. 2011[11]: motion capture calibrated by static biplane radiography); this quantity differs from local intra-articular engineering strain or direct force measurement in cadaveric knees. A: peak bundle relative elongation (mean ± 95% CI): stance peaks during walking and jogging from Nagai et al. 2019[14] (n = 10; l₀ = supine full-extension MRI), and peaks during the first 60% of stance in 5.0 m/s fast running and during the braking phase of 20 cm single-leg drop landing from Kamada et al. 2025[21] (n = 19, 38 knees bilaterally; l₀ = supine CT at 6.5° ± 3.5° of flexion). B: peak whole-ACL relative elongation: bimodal peaks during level walking from Englander et al. 2020[15] (n = 10, mean ± SD; l₀ = supine MRI at 8° ± 2°), the flight peak during 47 cm bilateral jump landing from Taylor et al. 2011[11] (n = 8, mean ± 95% CI; l₀ = supine MRI at 16.6° ± 6.2°), and the local peak of the group-mean flight curve during a single-leg jump in place from Englander et al. 2021[18] (n = 8, mean ± SD).
References
- [1]
Amis AA, Dawkins GP. Functional anatomy of the anterior cruciate ligament. Fibre bundle actions related to ligament replacements and injuries. J Bone Joint Surg Br. 1991;73(2):260-267. DOI: 10.1302/0301-620x.73b2.2005151 PMID: 2005151
- [2]
Fleming BC, Beynnon BD, Tohyama H, Johnson RJ, Nichols CE, Renström P, Pope MH. Determination of a zero strain reference for the anteromedial band of the anterior cruciate ligament. J Orthop Res. 1994;12(6):789-795. DOI: 10.1002/jor.1100120606 PMID: 7983554
- [3]
Beynnon BD, Fleming BC, Johnson RJ, Nichols CE, Renström PA, Pope MH. Anterior cruciate ligament strain behavior during rehabilitation exercises in vivo. Am J Sports Med. 1995;23(1):24-34. DOI: 10.1177/036354659502300105 PMID: 7726347
- [4]
Markolf KL, Burchfield DM, Shapiro MM, Shepard MF, Finerman GA, Slauterbeck JL. Combined knee loading states that generate high anterior cruciate ligament forces. J Orthop Res. 1995;13(6):930-935. DOI: 10.1002/jor.1100130618 PMID: 8544031
- [5]
Sakane M, Fox RJ, Woo SL, Livesay GA, Li G, Fu FH. In situ forces in the anterior cruciate ligament and its bundles in response to anterior tibial loads. J Orthop Res. 1997;15(2):285-293. DOI: 10.1002/jor.1100150219 PMID: 9167633
- [6]
Beynnon BD, Johnson RJ, Fleming BC, Stankewich CJ, Renström PA, Nichols CE. The strain behavior of the anterior cruciate ligament during squatting and active flexion-extension. A comparison of an open and a closed kinetic chain exercise. Am J Sports Med. 1997;25(6):823-829. DOI: 10.1177/036354659702500616 PMID: 9397272
- [7]
Li G, Rudy TW, Sakane M, Kanamori A, Ma CB, Woo SL. The importance of quadriceps and hamstring muscle loading on knee kinematics and in-situ forces in the ACL. J Biomech. 1999;32(4):395-400. DOI: 10.1016/s0021-9290(98)00181-x PMID: 10213029
- [8]
Gabriel MT, Wong EK, Woo SL, Yagi M, Debski RE. Distribution of in situ forces in the anterior cruciate ligament in response to rotatory loads. J Orthop Res. 2004;22(1):85-89. DOI: 10.1016/s0736-0266(03)00133-5 PMID: 14656664
- [9]
Wu JL, Seon JK, Gadikota HR, Hosseini A, Sutton KM, Gill TJ, Li G. In situ forces in the anteromedial and posterolateral bundles of the anterior cruciate ligament under simulated functional loading conditions. Am J Sports Med. 2010;38(3):558-563. DOI: 10.1177/0363546509350110 PMID: 20044500
- [10]
Fleming BC, Renstrom PA, Beynnon BD, Engstrom B, Peura GD, Badger GJ, Johnson RJ. The effect of weightbearing and external loading on anterior cruciate ligament strain. J Biomech. 2001;34(2):163-170. DOI: 10.1016/s0021-9290(00)00154-8 PMID: 11165279
- [11]
Taylor KA, Terry ME, Utturkar GM, Spritzer CE, Queen RM, Irribarra LA, Garrett WE, DeFrate LE. Measurement of in vivo anterior cruciate ligament strain during dynamic jump landing. J Biomech. 2011;44(3):365-371. DOI: 10.1016/j.jbiomech.2010.10.028 PMID: 21092960
- [12]
Skelley NW, Castile RM, York TE, Gruev V, Lake SP, Brophy RH. Differences in the microstructural properties of the anteromedial and posterolateral bundles of the anterior cruciate ligament. Am J Sports Med. 2015;43(4):928-936. DOI: 10.1177/0363546514566192 PMID: 25634908
- [13]
Castile RM, Skelley NW, Babaei B, Brophy RH, Lake SP. Microstructural properties and mechanics vary between bundles of the human anterior cruciate ligament during stress-relaxation. J Biomech. 2016;49(1):87-93. DOI: 10.1016/j.jbiomech.2015.11.016 PMID: 26643578
- [14]
Nagai K, Gale T, Chiba D, Su F, Fu FH, Anderst W. The Complex Relationship Between In Vivo ACL Elongation and Knee Kinematics During Walking and Running. J Orthop Res. 2019;37(9):1920-1928. DOI: 10.1002/jor.24330 PMID: 31042309
- [15]
Englander ZA, Garrett WE, Spritzer CE, DeFrate LE. In vivo attachment site to attachment site length and strain of the ACL and its bundles during the full gait cycle measured by MRI and high-speed biplanar radiography. J Biomech. 2020;98:109443. DOI: 10.1016/j.jbiomech.2019.109443 PMID: 31679755
- [16]
Bates NA, Schilaty ND, Krych AJ, Hewett TE. In vivo attachment site to attachment site length and strain of the ACL and its bundles during the full gait cycle measure by MRI and high-speed biplanar radiography. (Published Jan. 2, 2020). J Biomech. 2020;109:109922. DOI: 10.1016/j.jbiomech.2020.109922 PMID: 32698953
- [17]
Englander ZA, Spritzer CE, DeFrate LE. In vivo attachment site to attachment site length and strain of the ACL and its bundles during the full gait cycle measured by MRI and high-speed biplanar radiography: Response. J Biomech. 2020;109:109918. DOI: 10.1016/j.jbiomech.2020.109918 PMID: 32660758
- [18]
Englander ZA, Lau BC, Wittstein JR, Goode AP, DeFrate LE. Patellar Tendon Orientation and Strain Are Predictors of ACL Strain In Vivo During a Single-Leg Jump. Orthop J Sports Med. 2021;9(3):2325967121991054. DOI: 10.1177/2325967121991054 PMID: 33796591
- [19]
Foody JN, Bradley PX, Spritzer CE, Wittstein JR, DeFrate LE, Englander ZA. Elevated In Vivo ACL Strain Is Associated With a Straight Knee in Both the Sagittal and the Coronal Planes. Am J Sports Med. 2023;51(2):422-428. DOI: 10.1177/03635465221141876 PMID: 36625427
- [20]
Foody JN, Tayne S, Englander ZA, Kosinski AS, Amendola A, Spritzer CE, Wittstein JR, DeFrate LE. Does Tibial Plateau Slope and Depth Influence ACL Strain In Vivo?. Orthop J Sports Med. 2024;12(12):23259671241271662. DOI: 10.1177/23259671241271662 PMID: 39669712
- [21]
Kamada K, Gale T, Nukuto K, Musahl V, Anderst W. Anterior Cruciate Ligament Bundles Elongation Patterns During Fast Running and Single-Leg Drop Landing: An In Vivo Biplane Radiography Study. Orthop J Sports Med. 2025;13(12):23259671251399819. DOI: 10.1177/23259671251399819 PMID: 41393806
- [22]
Markolf KL, Gorek JF, Kabo JM, Shapiro MS. Direct measurement of resultant forces in the anterior cruciate ligament. An in vitro study performed with a new experimental technique. J Bone Joint Surg Am. 1990;72(4):557-567. DOI: 10.2106/00004623-199072040-00014 PMID: 2324143
- [23]
Markolf KL, Burchfield DM, Shapiro MM, Cha CW, Finerman GA, Slauterbeck JL. Biomechanical consequences of replacement of the anterior cruciate ligament with a patellar ligament allograft. Part II: forces in the graft compared with forces in the intact ligament. J Bone Joint Surg Am. 1996;78(11):1728-1734. DOI: 10.2106/00004623-199611000-00014 PMID: 8934489
- [24]
Markolf KL, Park S, Jackson SR, McAllister DR. Contributions of the posterolateral bundle of the anterior cruciate ligament to anterior-posterior knee laxity and ligament forces. Arthroscopy. 2008;24(7):805-809. DOI: 10.1016/j.arthro.2008.02.012 PMID: 18589269