1. Diagnostic Accuracy
MRI diagnosis of anterior cruciate ligament (ACL) injury comprises three judgments—injury recognition, tear grade (complete or partial), and tear location—whose reliability differs markedly. Injury recognition is the most reliable: two meta-analyses both reported pooled sensitivity of 87% and specificity of 90%–93%; these pooled values count partial and complete tears together as positive, or collectively as "ACL injury," and cannot be used to estimate the reliability of judgments of tear grade or tear location. Recognition of partial tears is substantially poorer: in several studies using conventional MRI, the proportion of arthroscopically confirmed partial tears correctly diagnosed on MRI was 25%–77%. Judgment of tear location is likewise unreliable: in one prospective study of 174 complete tears, overall agreement between MRI and arthroscopic typing was 43%.
Interpretation centers on the femoral end of the ACL—the attachment on the medial face of the lateral femoral condyle (lateral wall of the intercondylar notch). In the 174-case series above, about seven tenths of tears seen at surgery lay at the femoral attachment or proximal to it, yet MRI classified two thirds as midsubstance tears (Silverman et al., 2025, Section 3). Two other typical misinterpretations also occur in this segment: in chronic tears the stump may adhere by scarring to the posterior cruciate ligament (PCL) or the roof of the notch, producing an apparently continuous ligament; and partial-volume averaging between a normal ACL and the notch roof or lateral femoral condyle may make an intact ligament appear torn. To call the ACL intact, one must track it slice by slice from the femoral to the tibial end and confirm on coronal or axial images that fibers attach normally to the lateral wall of the notch.
Gains from examination technique likewise concentrate at the femoral end. Oblique sagittal planes parallel to the lateral wall of the notch, in controlled studies, act most clearly by reducing misdiagnosis of a normal ACL as torn; oblique coronal, oblique axial, and mild knee flexion within the knee coil make the femoral end, the stump, and the two bundles clearer; in within-patient comparisons, 3 T and three-dimensional sequences diagnosed ACL tears with performance similar to conventional protocols (Section 2). An MRI "partial tear" is a judgment based on ligament signal, fiber morphology, and course; it does not establish whether residual fibers still function. Function must be judged by physical examination and laxity measurement (Section 4).
Throughout this chapter, ACL means the unoperated ACL (hereafter the native ACL). The cited material concerns mainly adult trauma. Treatment choices for partial tears are covered in the chapter Partial ACL Tear: Decision between Conservative Treatment and Reconstruction.
Unless otherwise stated, diagnostic indices in the text take arthroscopy as the reference standard. Sensitivity is the proportion of arthroscopically confirmed tears that MRI called torn; specificity is the proportion of arthroscopically confirmed intact ACLs that MRI called intact. The positive likelihood ratio equals sensitivity / (1 − specificity), and the negative likelihood ratio equals (1 − sensitivity) / specificity; they express the factor by which a positive or negative MRI multiplies the odds of tear. A likelihood ratio of 1 means the examination adds no information. Pretest probability is the estimated likelihood of tear from history and examination before MRI; post-test probability is that likelihood after the MRI result. An area under the ROC curve (AUC) of 0.5 is equivalent to chance judgment; 1.0 is perfect discrimination.
Two Meta-analyses
Phelan et al. (2016) searched through March 2014 and included only prospective studies that used arthroscopy or open surgery as the reference standard and were free of verification bias. For the ACL subset (14 studies, 930 patients), sensitivity was 87% (95% CI 77%–94%) and specificity 93% (91%–96%), with both partial and complete tears counted as positive (original p. 2, Table 2). The 14 studies were published from 1989 through 2009 at field strengths of 0.1–1.5 T; none was performed at 3 T. The eight 1.5 T studies versus the six lower-field studies showed sensitivity 86% versus 91% and specificity 94% versus 93% (original Tables 1 and 2). The review quality-assessed all 21 included studies: for the reference-standard domain, bias risk was high or unclear in most; for patient selection, the main concern was applicability (original p. 3, Fig. 2).
Li et al. (2017) included 21 studies from 2006–2016 (1,722 patients), with pooled sensitivity 87% (84%–90%), specificity 90% (88%–92%), positive likelihood ratio 6.78, negative likelihood ratio 0.16, and AUC 0.93 (original p. 2, Table 2). Differences between field strength ≥1.5 T and <1.5 T were not statistically significant, but of 522 patients in the latter group, 379 came from a single 0.2 T study, so that group's pooled values are driven largely by that one study (original Tables 1 and 2). The Abstract states that there was neither a threshold effect nor a non-threshold effect among studies, yet the body reports I² for sensitivity and specificity of 57.9% and 72.7% (both P < 0.001) (original p. 2). Among included studies the arthroscopically confirmed ACL-injury rate ranged from about 11% to 74%, encompassing both studies dedicated to locked knees and studies that used a smartphone DICOM viewer for reading (original Table 1). With heterogeneity of this magnitude, the pooled values serve only as overall-level estimates. The paper pooled sensitivity, specificity, and likelihood ratios separately rather than using a bivariate model that jointly handles their correlation; the separately pooled positive likelihood ratio (6.78) differs from the value converted from the pooled sensitivity and specificity (about 8.7) because of the aggregation method, not calculation error, but this affects post-test probability estimates.
Pretest Probability and MRI Results
Subjects in the studies above were patients clinically suspected of ACL or meniscal injury who ultimately underwent arthroscopy. Outpatients have widely varying pretest probabilities, and the meaning of a given MRI result changes accordingly. Using the pooled sensitivity and specificity from the two meta-analyses, the negative likelihood ratio is about 0.14 and the positive about 9–12: when history and examination suggest an 80% likelihood of tear, MRI-negative post-test probability remains about 36%; at 50% pretest, about 12% after a negative MRI; at 10% pretest with a positive MRI, post-test probability is about 49%–58%. Using the separately pooled likelihood ratios from Li et al. (2017) (positive 6.78, negative 0.16), post-test probabilities after a negative MRI at 80% and 50% pretest are about 39% and 14%, and after a positive MRI at 10% pretest about 43%. These are approximate estimates: the likelihood ratios come from populations that underwent arthroscopy, and physical examination and MRI results are not independent of each other.
In Qureshi et al. (2026), all 35 patients underwent therapeutic arthroscopy after trauma; 31 (89%) had ACL injury at arthroscopy. That figure is the proportion among surgically selected cases and may itself have been influenced by MRI results; it cannot be taken as an independently estimated clinical probability before imaging. In this series with a high proportion of ACL injuries, using the original preoperative imaging reports, 2 of 6 MRI-negative cases still had ACL injury at arthroscopy (original Tables 3 and 4). Sensitivity of 93.5% (29/31) can be recalculated from the 2×2 table; specificity of 100% rests on only 4 normal ACLs, with an approximate 95% CI of 40%–100% (calculated from the published numbers), and the report did not separate partial from complete tears.
When history and examination strongly suggest tear (for example hemarthrosis shortly after injury, a soft endpoint on the Lachman test, or a positive pivot shift) and MRI is reported negative, the MRI result should not be used to exclude tear. The author advocates first re-reading the source images: whether fibers attach normally to the lateral wall of the notch on coronal and axial images, and whether "continuity" on sagittal images is in fact a chronic stump adherent to the PCL (Sections 3 and 5, Fig. 3). If uncertainty remains, repeating MRI with the original protocol is of limited value; choose an examination that answers the specific question—add oblique coronal, oblique axial, or flexed-knee images to display the femoral end (Section 2), or examine laxity under anesthesia. Conversely, when examination shows stability but MRI suggests tear, first consider partial tear, mucoid degeneration, and an intact ligament with altered signal but continuous fibers (Sections 4 and 6).
Study Conditions Affecting Diagnostic Indices
Case mix. Many studies compare only arthroscopically confirmed complete tears with intact ACLs—for example Tung et al. (1993), who randomly selected 50 complete tears and 53 normal ACL examinations in 49 patients from one surgeon's arthroscopic cases, and Brandser et al. (1996), 34 versus 40. Such samples omit the hardest category, partial tears, and inflate the indices. The tear groups also differed: all 34 in Brandser et al. were imaged within 6 weeks of injury; of Tung et al.'s 50, 30 were imaged within 9 weeks and 20 after 9 weeks (original p. 663). Counting partial tears as positive or negative also changes results: Van Dyck et al. (2011) at 3 T reported sensitivity of 93% for "any tear" and 77% when partial tears were scored separately.
Overall accuracy. Overall accuracy depends on group sizes and each group's accuracy; larger groups weigh more. In Van Dyck et al. (2011), 132 of 172 ACLs were intact; overall accuracy for the "partial tear" category was 95% (163/172), yet sensitivity for partial tear in the same data was 77% (13/17), and of 18 MRI-diagnosed partial tears, 13 (72%) were confirmed at arthroscopy (original Table 1, calculated from the published table).
Reading method. In two studies from the same hospital and period, prospective consensus reading yielded a partial-tear detection rate of 77% (Van Dyck et al., 2011), whereas independent retrospective reading without knowledge of clinical or arthroscopic findings yielded 25%–53% (Van Dyck et al., 2012). Case mix also differed between the two studies; the difference cannot be attributed entirely to reading method.
Reference standard. Arthroscopists often know the MRI result. In Phelan et al.'s subgroup analysis, pooled sensitivity was 82% (61%–93%) in 6 studies in which surgeons were blinded to MRI and 90% (77%–96%) in 5 in which they were not; confidence intervals overlapped widely, and the original paper did not test between groups (original Table 2). Arthroscopy itself may also miss intrasubstance ligament injury.
The Report by Zhao et al. (2020)
Zhao et al. (2020) reported 78 patients with high suspicion of ACL injury, of whom arthroscopy confirmed injury in 66 (28 complete, 38 partial) and normality in 12, claiming MRI sensitivity 95.45% (63/66), specificity 91.67%, accuracy 94.87%, and "accuracy" for complete and partial tears of 92.86% and 94.74%. Al Mohammad and Gharaibeh (2024), Piedade et al. (2025), and Başbuğ et al. (2026) all cite these figures. They cannot be used:
- The same cohort has two different miss counts: in original Table 1, of 66 arthroscopically positive cases, MRI was negative in 3; on the same page Table 2 lists MRI typing of the same 66 as 28 complete, 37 partial, and 1 normal—i.e., 1 miss (original p. 3). The paper offers no explanation.
- The so-called "accuracy" figures are typing detection rates: 92.86% is 26/28 and 94.74% is 36/38—the proportions of arthroscopically confirmed complete and partial tears that MRI typed correctly—containing no negative cases.
- The reference standard may have been influenced by MRI: arthroscopy was performed one week after MRI, with "focused observation of regions shown abnormal on MRI" (original p. 2), so agreement may be inflated. Specificity rests on 12 normal knees (11/12; exact 95% CI 62%–100%, calculated from the published numbers).
- Citations do not match the content: statements in the Discussion about tear-location distribution and "arthroscopic accuracy up to 100%" cite, respectively, studies of meniscal transplantation, semitendinosus morphology, and cartilage injury in ACL revision; the paper writes the diameter of arthroscopic instruments as "about 5 cm," yet the cited source is a scale-translation study (original pp. 5–6 and references 11, 12, 19, 20).
Sensitivity and specificity for individual signs in the original Tables 3 and 4 come from the same dataset and are likewise not used in this chapter. The authors declare no funding and no conflicts of interest (original p. 6).
2. Examination Methods
Conventional knee MRI is sufficient to diagnose most complete tears. What examination technique must solve is display of the full ACL length—especially the femoral end, the stump, and the two bundles. Evaluation of a new position, sequence, or device should separately assess display quality and diagnostic performance: the former can be confirmed by paired observation in the same patient; the latter requires controlled studies with arthroscopy as reference. Improved display has direct value for interpretation; how much diagnostic performance improves must rest on controlled data.
Positioning
The standard examination is performed supine with the knee in a dedicated knee coil. The 2016 reference protocol of the European Society of Musculoskeletal Radiology (ESSR) Sports Imaging Subcommittee specifies supine positioning and a dedicated knee coil but does not specify flexion angle (original p. 4); the 2025 revision of the American College of Radiology (ACR) Practice Parameter for MRI of the Knee, with the Society of Pediatric Radiology and the Society of Skeletal Radiology, states that patients are usually supine with the knee fully or nearly fully extended, and that mild external rotation is often for comfort (original section IV.C). These are descriptions of usual practice, not comparisons among flexion angles. So-called extension is not in fact 0°: Niitsu et al. (1998), measuring inside a standard cylindrical knee coil, found the extended position to be 0°–10° (mean 3°); with a small pad under the popliteal fossa and with ankle fixation and the long pad under the body removed, the knee could flex to 10°–30° (mean 17°), the attainable flexion depending on lower-leg length (original pp. 113–114 and Fig. 1).
| Knee position | Actual angle and method | Nature |
|---|---|---|
| Extended or nearly extended | Supine, dedicated knee coil; Niitsu et al. measured 0°–10° (mean 3°) | Routine |
| Mild flexion | Pad under the popliteal fossa within a standard coil, 10°–30° (mean 17°) (Niitsu et al.); Tung et al. (1993) used 5°–10° | Adjustments usable in routine practice |
| About 30° or 55° | Dedicated positioning device with flexible surface coils; Muhle et al. (2013) measured 28°–43° and 52°–72.5° | Research methods |
| Maximal flexion | Prone (Gunaydin et al., 2019, mean 124.5°) or lateral decubitus (Xu Z et al., 2021) | Special research protocols; may be impossible with pain or swelling |
In extension the ACL lies nearly parallel and close to the notch roof; partial volume between the anterior ACL margin and the roof can obscure fiber contours, and partial volume also exists between the femoral end and the medial face of the lateral femoral condyle. After flexion the femur and roof rotate together, the space below the roof enlarges, the ACL moves away from the roof, and partial volume at the femoral end decreases (Niitsu et al., 1998, pp. 114–115; Ng et al., 2011, p. 77) (Fig. 1). This is a spatial relationship among normal structures and its effect on imaging, not pathologic impingement. In Niitsu et al.'s 40 cases, after excluding 7 with ACL absence from chronic tear, 33 underwent oblique sagittal scanning in the same coil in both extension and mild flexion; two authors scored paired images while aware of position. For full ACL length, after further excluding 3 with ligament fragmentation, 30 cases yielded 60 ratings, of which 57% (34/60) favored mild flexion; for the femoral attachment, after excluding 4 with complete femoral-end rupture, 29 cases yielded 58 ratings, of which 53% (31/58) favored mild flexion; no rater scored mild flexion worse in more than 2 cases (original pp. 113–115 and Table 1). The study did not compare diagnostic performance or determine an optimal angle; what it confirmed is that mild flexion improves display of the full ACL length and femoral attachment.
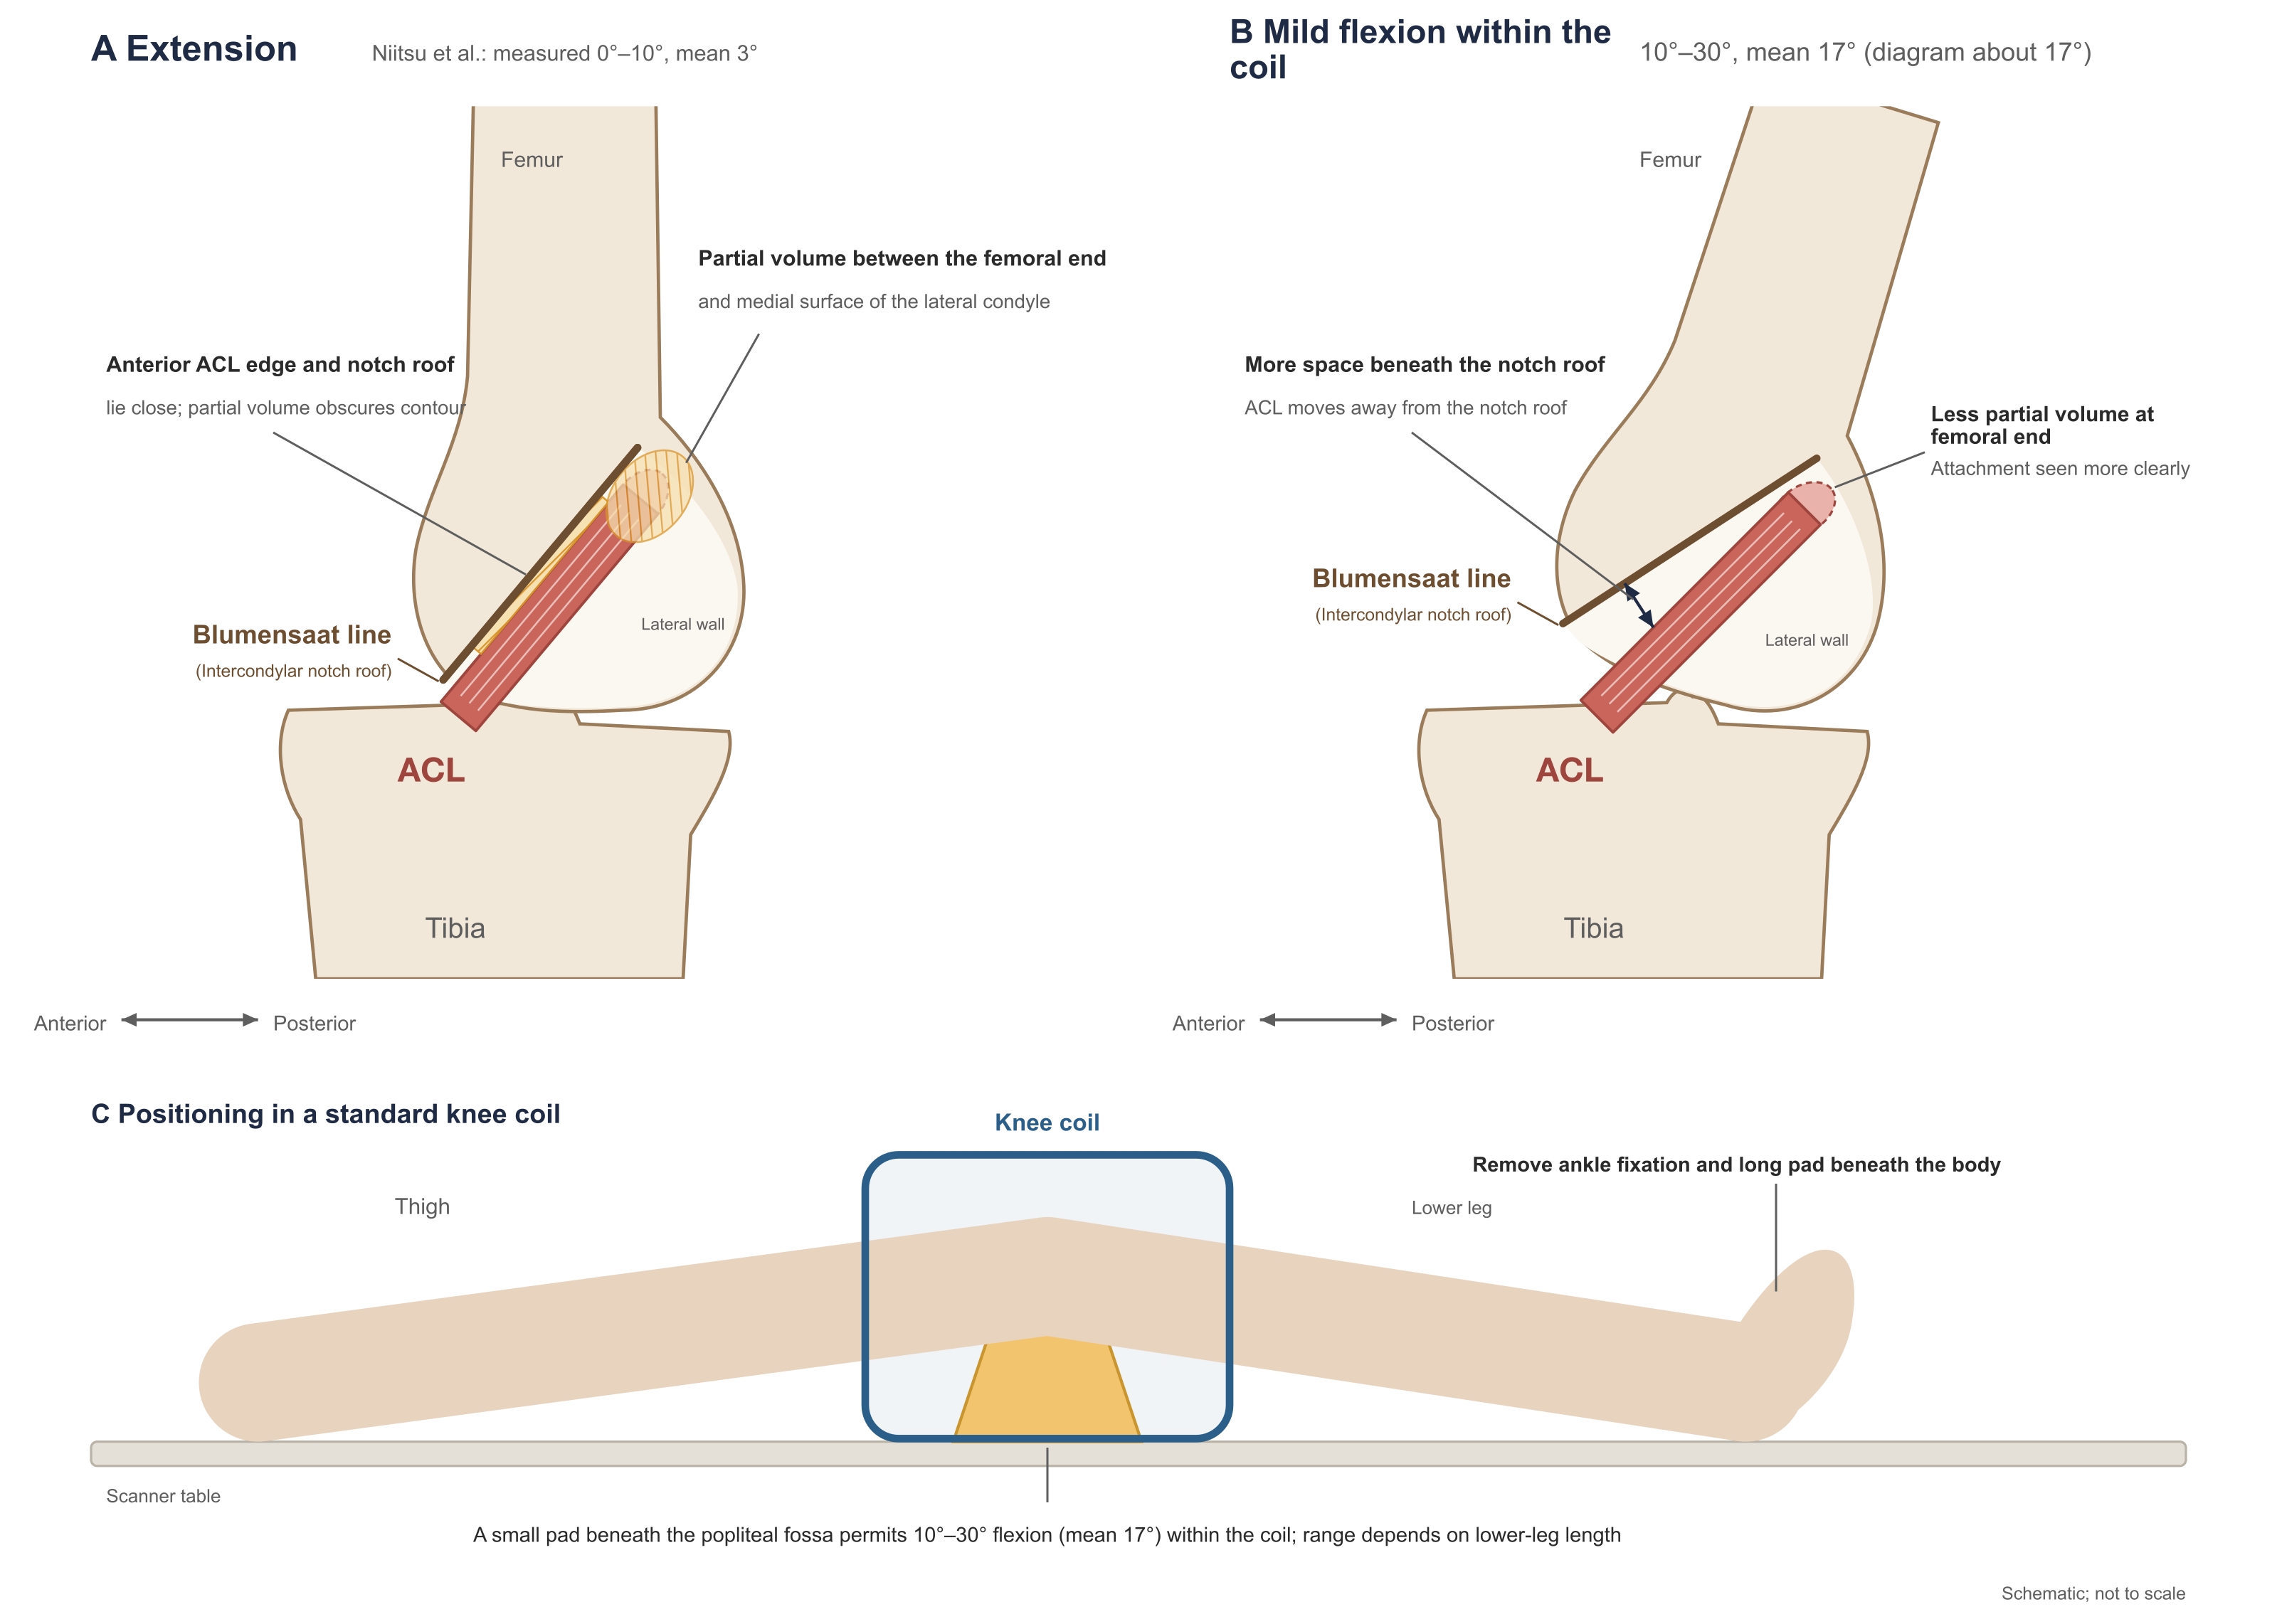
Figure 1. Relationship of the ACL to the notch roof in extension and in mild flexion within the knee coil.
A and B are sagittal; anterior is to the left. A. Extension: the ACL lies nearly parallel and close to the notch roof (Blumensaat line); partial volume exists between the anterior ACL margin and the roof and between the femoral end and the lateral wall. B. Mild flexion within the coil: the femur and roof rotate, the space below the roof enlarges, and the ACL moves away from the roof. C. Positioning method: a small pad under the popliteal fossa supports the back of the knee; ankle fixation and the long pad under the body are removed (Niitsu et al., 1998). The drawings show apposition of normal structures and its imaging effect, not pathologic impingement; the optimal flexion angle has not been determined.
Mild external rotation is often used to align the sagittal plane with the ACL course; angles in the literature range from 5°–10° (Al Mohammad and Gharaibeh, 2024, p. 235), through 10°–15° (Vahey et al., 1991, 1993), to 15°–20° (Tung et al., 1993). The ESSR 2016 reference protocol does not require external rotation and specifies that the oblique sagittal plane be parallel to the medial face of the lateral femoral condyle (original p. 4); Kwon et al. (2009) and Park et al. (2014) both prescribed the oblique sagittal plane in that direction on a coronal localizer (original p. 292; p. W201). The material in this chapter contains no study comparing diagnostic performance across external-rotation angles.
Within the space the coil allows, mild flexion should be routine: it does not add scan time, and paired observation in the same coil has shown improved femoral-end display. Greater flexion is limited by standard-coil space and patient tolerance; research studies often switch to flexible coils or dedicated positioning devices (Muhle et al., 2013; Xu Z et al., 2021) for cases in which the femoral end or stump is unclear on routine images (see "Flexed-Knee Scanning" below).
Standard Examination Protocol
The ESSR 2016 reference protocol is summarized below (original p. 5). Field of view and slice thickness are upper limits and matrix a lower limit; they are not optimal parameters for modern equipment. "Intermediate weighted" denotes long-TR sequences with TE between proton-density and T2 weighting, balancing anatomic display and fluid sensitivity (original p. 3).
| Sequence | Plane and prescription | Max FOV | Max slice thickness | TE (ms) | Min matrix |
|---|---|---|---|---|---|
| Intermediate-weighted fat-suppressed | Axial, parallel to the joint line | 16 cm | 4 mm | 40–50 | 256×256 |
| Intermediate-weighted fat-suppressed | Coronal, parallel to the posterior femoral condyles | 18 cm | 4 mm | 40–50 | 288×288 |
| T1-weighted | Coronal | 18 cm | 4 mm | shortest | 288×288 |
| Intermediate-weighted fat-suppressed | Oblique sagittal, parallel to the medial face of the lateral femoral condyle | 16 cm | 4 mm | 40–50 | 288×288 |
| Proton-density–weighted | Oblique sagittal | 16 cm | 4 mm | 20–30 | 288×288 |
| Proton-density–weighted (optional) | Oblique coronal, parallel to the ACL | 16 cm | 4 mm | 20–30 | 288×288 |
ACL diagnosis rests primarily on sagittal images (Yang T et al., 2025, p. 476); coronal and axial images are used for confirmation. The ESSR 2024 practice recommendations (Parkar and Adriaensen, 2024) require: both 1.5 T and 3 T are acceptable; when three-dimensional sequences are not used, sagittal, coronal, and axial planes should be included, with the sagittal plane mildly tilted if needed to show the full ACL length on as few slices as possible; the protocol must include T1-weighted images and fluid-sensitive T2-class sequences; 4 mm slice thickness is acceptable, but most modern systems can achieve slices thinner than 3 mm, which are preferable (original p. 6591).
ACR has two documents that address knee MRI parameters, for different purposes. The 2025 Practice Parameter requires a local coil wrapping the knee; when parallel imaging is used the coil should have 8 or more elements; for conventional sequences FOV should not exceed 16 cm, and sagittal and coronal slice thickness should not exceed 4 mm; young children should use a smaller FOV (<14 cm) and thinner slices (2.5–3.5 mm); after nearly isotropic three-dimensional sequences are reconstructed into multiple planes, multiplanar two-dimensional acquisition may be omitted (original section IV.C).
The ACR 2025 MRI accreditation parameters are lower bounds on image quality for submitted accreditation images: at least one non–fat-suppressed T1-weighted sequence and one fat-suppressed fluid-sensitive sequence; fluid-sensitive sequences in sagittal, coronal, and axial planes must all clearly show the cruciate ligaments; slice thickness ≤4.0 mm and interslice gap ≤1.0 mm for each sequence, with pixel area preferably ≤0.6 mm²; either two- or three-dimensional acquisition is acceptable, but for accreditation submission, images reconstructed from one plane cannot substitute for actual acquisition in another (ACR accreditation parameters, knee section and general rules). The last rule constrains only accreditation submission; whether three-dimensional reconstruction can replace two-dimensional acquisition clinically is discussed under "Field Strength and Three-Dimensional Sequences" below. Neither document is a clinical study comparing parameter superiority.
The ESSR 2024 recommendations require that, regardless of the stated purpose on the request, all ligaments, menisci, cartilage, bone and marrow, and soft tissues be evaluated, to avoid missing concomitant injury and incidental findings; in acute trauma MRI should be combined with radiographs or CT so that small avulsion fractures are not missed (original p. 6591). T1-weighted images are used to show marrow lesions and fracture lines and must not be replaced by proton-density–weighted images (original p. 6591).
Scan Parameters and ACL Visualization
In-plane resolution. Pixel size equals FOV divided by acquisition matrix. ACR accreditation calculates from the actual acquired phase- and frequency-encode counts and does not accept interpolated reconstruction matrices (ACR accreditation parameters, general rules); an image labeled "512×512" need not have higher in-plane resolution. At the ESSR upper limits, a 16 cm FOV and 288 matrix give a pixel of about 0.56 mm. Ng AW et al. (2013) used oblique-axial in-plane voxels of 0.25×0.31 mm versus conventional sagittal 0.40×0.54 mm (original p. 210); part of the gain from the added plane in that study came from the simultaneous increase in resolution.
Slice thickness and gap. Even when prescribed obliquely, the ACL usually appears on 2–3 contiguous sagittal or coronal slices; on oblique axial images perpendicular to the ACL, Ng AW et al. (2013) obtained 6–8 slices (original p. 214) and Ng et al. (2011) 11–15 (original pp. 78–79). The thicker the slice, the more readily signal from ligament, notch roof, lateral femoral condyle, surrounding fat, and effusion averages within the same voxel, and the more marked the partial-volume effect. Interslice gap has a different effect: widening the gap leaves unsampled tissue between adjacent slices, makes ligament display discontinuous, and may miss small focal abnormalities that fall in the gap; the ACR Practice Parameter allows a gap but requires that it not impair complete display of intra-articular structures (original section IV.C). Two-dimensional slice thickness differs from isotropic voxels of three-dimensional sequences: three-dimensional sequences acquire at 0.5–0.7 mm voxels and are usually reconstructed to about 1.5 mm slices for reading (Kijowski et al., 2009, p. 488; Chagas-Neto et al., 2016, p. 71).
Weighting and fat suppression. Proton-density– or intermediate-weighted images display fiber course and continuity; fat-suppressed fluid-sensitive sequences show edema, hemorrhage, effusion, and bone contusion as high signal; T1-weighted images show marrow and fracture lines (Parkar and Adriaensen, 2024, p. 6591). Fat suppression may use chemical-shift (frequency-selective), inversion-recovery (STIR), Dixon, or water-excitation methods; ACR accreditation requires only that fluid signal be clearly higher than fat, not complete fat suppression (ACR accreditation parameters, general rules). Nonuniform fat suppression leaves residual fat signal that interferes with edema assessment. Descriptions of signal intensity must refer to the sequence used: Vahey et al. (1991) "edema approximately equal to fat" used images that retained fat signal and does not apply to fat-suppressed images (Section 5).
Coils, acceleration, and scan time. With coil, acceleration method, and signal-to-noise requirements held constant, raising resolution usually lengthens scan time; multichannel knee coils with parallel imaging can raise spatial resolution or shorten scan time (ACR Practice Parameter, section IV.C). In the two protocols of Van Dyck et al. (2013), 3 T sagittal slices were 2 mm with a 448×448 matrix and a single sequence took 7 min 9 s; 1.5 T sagittal slices were 3 mm with a 307×384 matrix and took 2 min 20 s (original Supplementary Table E-1). The longer the scan, the greater the chance of motion artifact.
Supplemental Sequences Directed at the ACL
Supplemental methods used in the material for this chapter are listed below; prescription directions are shown in Fig. 2.
| Supplement | Prescription | Slice thickness and time in the studies | Principal use |
|---|---|---|---|
| Oblique sagittal | Parallel to the medial face of the lateral femoral condyle on coronal or axial images | Kwon et al. 3 mm, no gap; Park et al. 3 mm; Kosaka et al. 2 mm; ESSR routine protocol already uses oblique sagittal | Display the full ACL length on one or a few slices |
| Dual-prescription thin-slice oblique sagittal | Along the ACL course on both axial and coronal images | Li et al. (2023) 2.3 mm, no gap, 3 min 24 s | Display the full ACL length on one or a few slices |
| Oblique coronal | Parallel to the notch roof or ACL on sagittal images | Kwon et al. 3 mm; Park et al. 3 mm; Gokalp et al. 1 mm, 6 min; Chen et al. (2024) 30° flexion, 1.2 mm, 2 min 51 s | Femoral attachment, course of the two bundles, stump attachment site |
| Oblique axial | Perpendicular to the ACL on sagittal and coronal images | Ng AW et al. 3 mm, in-plane 0.25×0.31 mm, about 4 min | Cross section of the ACL; separate display of the two bundles |
| Three-dimensional isotropic sequence | Single acquisition, multiplanar reconstruction | Kijowski et al. 0.7 mm, 5 min; Chagas-Neto et al. 0.6×0.6×0.7 mm, 5 min; Zhang et al. (2019) 0.6 mm, 4 min 53 s | Post hoc reconstruction of any oblique plane or curved plane along the ligament |
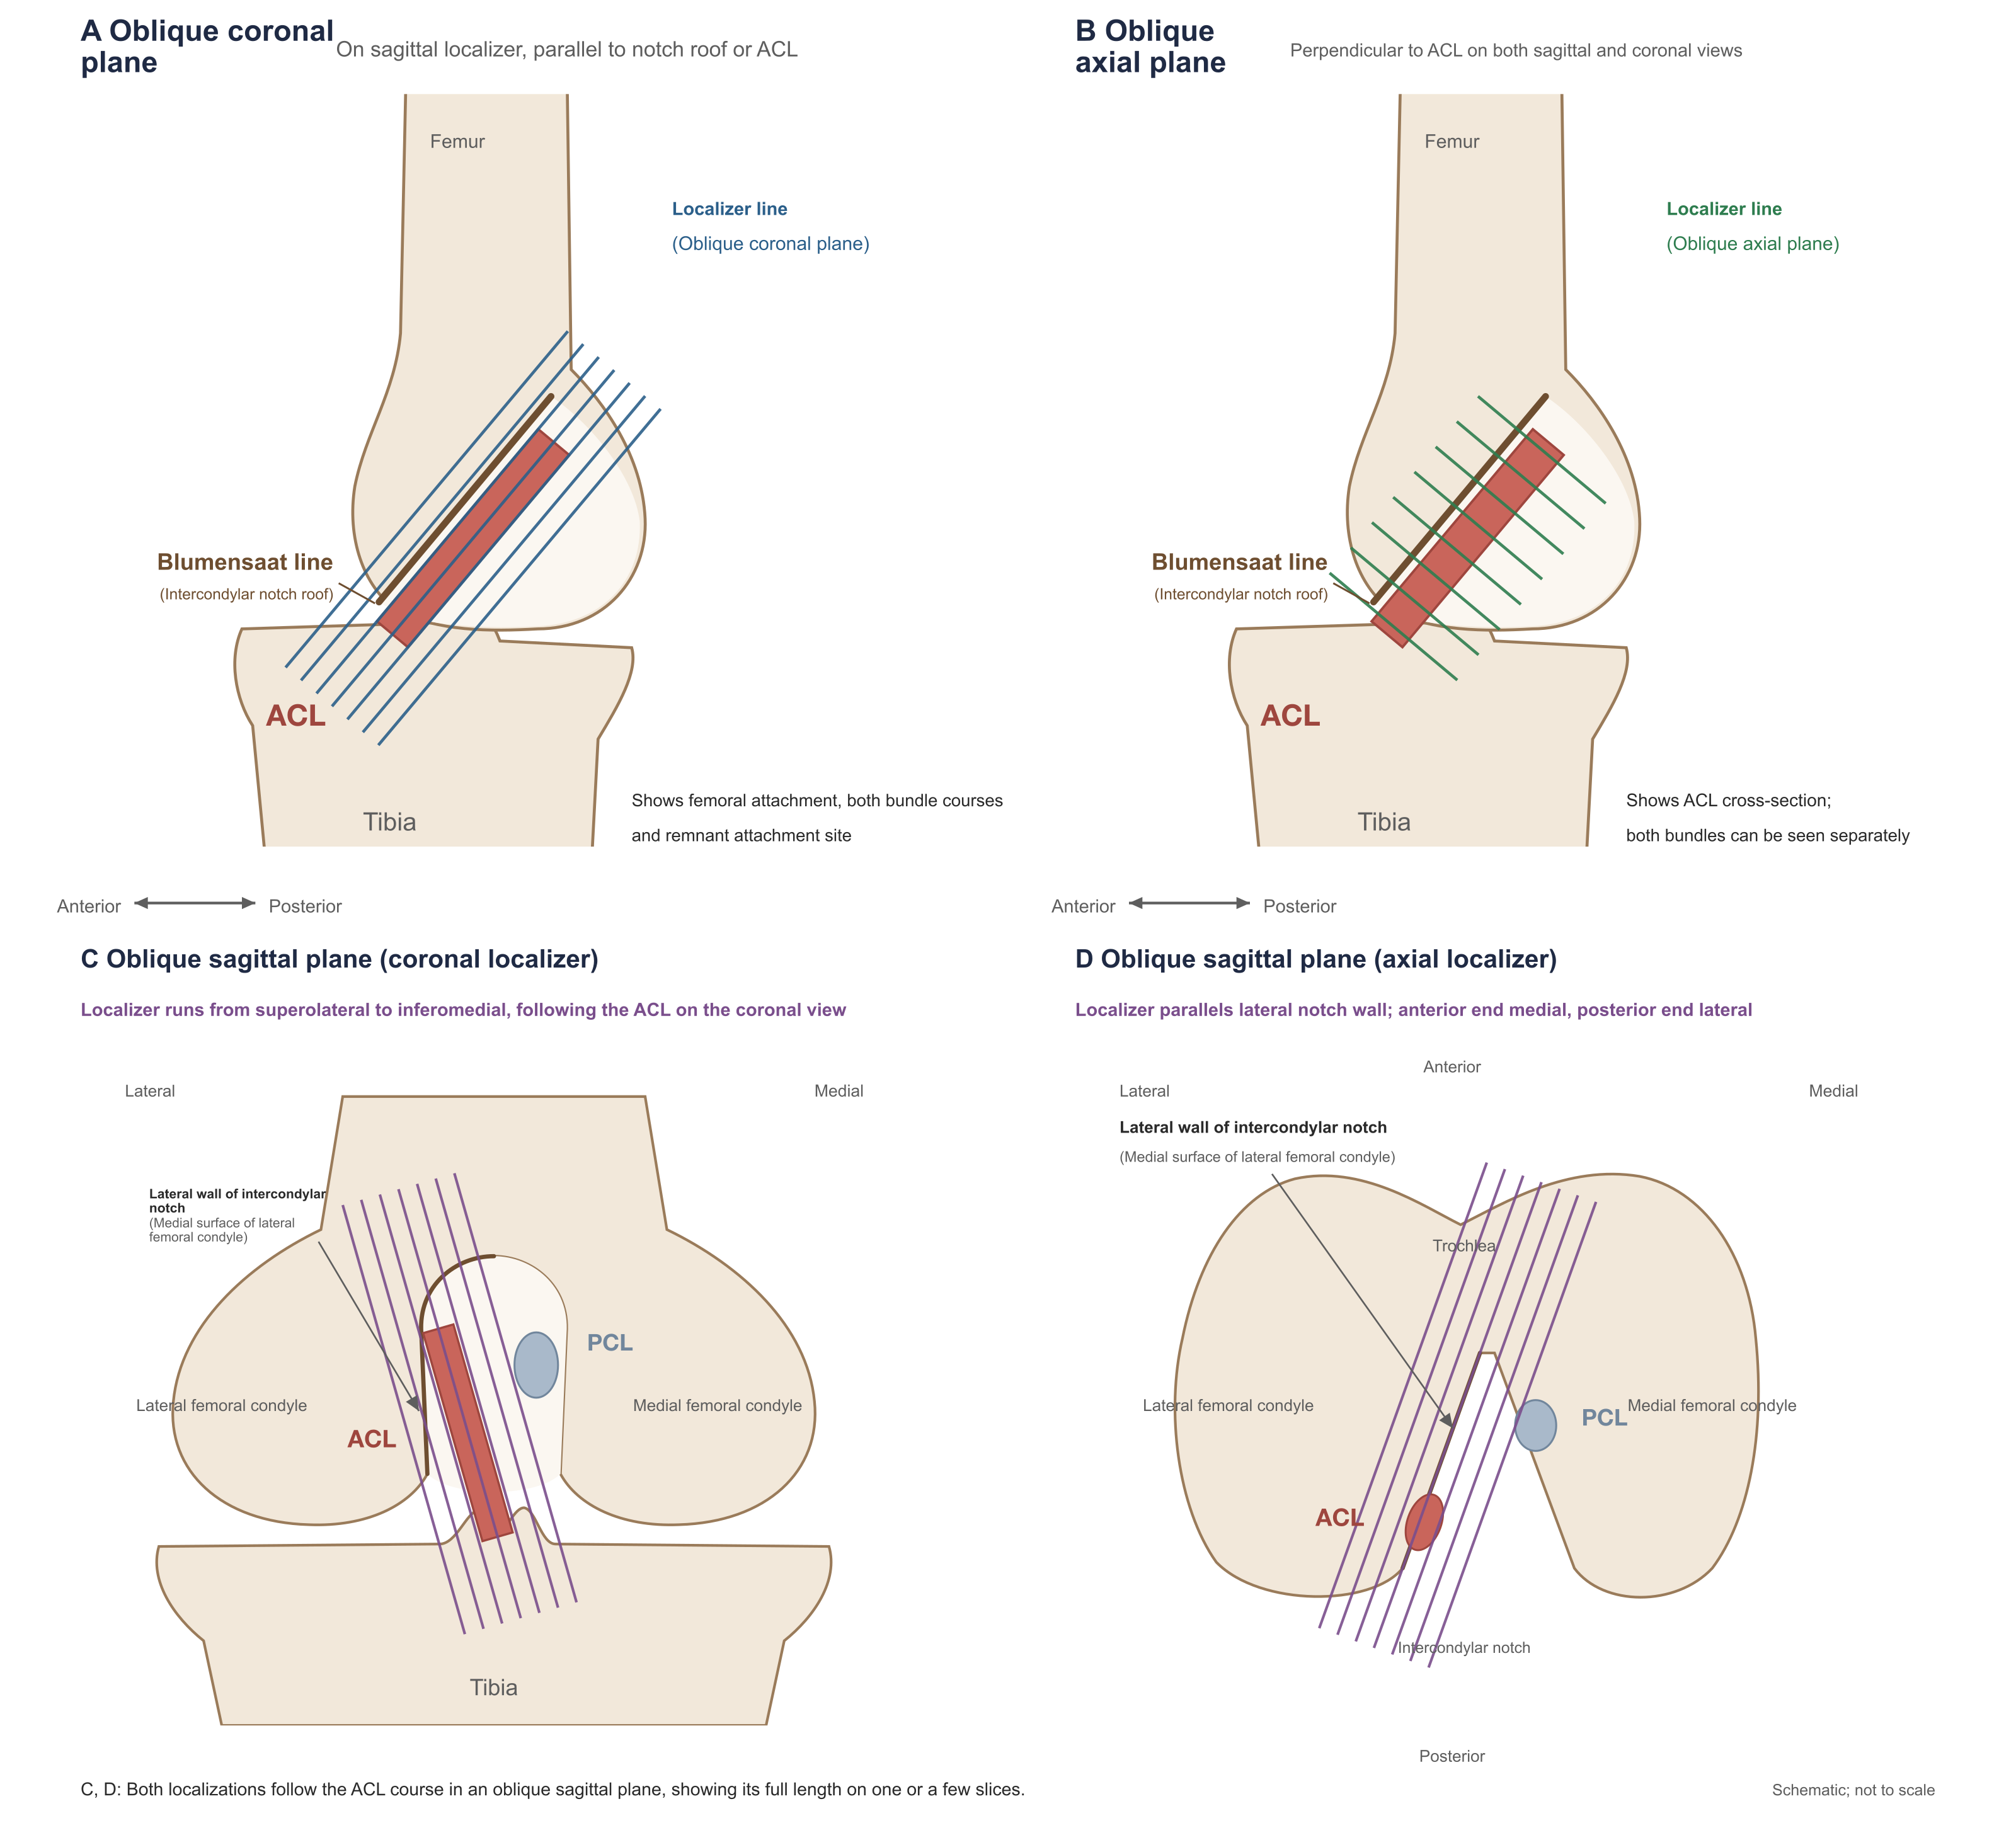
Figure 2. Prescription of oblique supplemental planes directed at the ACL.
A and B are sagittal localizers, anterior to the left: oblique coronal parallel to the notch roof or ACL (Kwon et al., Park et al.; Chen et al. parallel to the ACL at 30° flexion); oblique axial perpendicular to the ACL (Ng AW et al.). C and D are two prescriptions for the oblique sagittal plane, both aligning the scan plane with the ACL course: C is a posterior coronal slice (lateral to the left), with the prescription line running from superolateral to inferomedial (Kwon et al., Park et al.); D is axial (anterior up, lateral left), with the prescription line parallel to the lateral notch wall, anterior end more medial and posterior end more lateral. Li et al. (2023) prescribed along the ACL on both axial and coronal images. Slice thickness and scan times are in the table above.
Kwon et al. (2009) has the clearest study design in this group. Preoperative MRI in 101 cases always included three orthogonal planes plus two oblique planes (oblique coronal parallel to the notch roof; oblique sagittal parallel to the medial face of the lateral femoral condyle; both 3 mm proton-density–weighted); two musculoskeletal radiologists read four combinations in scrambled order. With orthogonal planes alone, 10 of 61 intact ACLs were misdiagnosed as torn (specificity 84%, 51/61); adding either oblique coronal or oblique sagittal alone left 3 false positives (specificity 95%, 58/61), McNemar P = 0.016 and 0.039 versus orthogonal alone; adding both oblique planes left 1 (specificity 98%, 60/61), P = 0.004. Sensitivity 95% versus 97.5% did not differ significantly; both oblique planes versus either alone (1 versus 3 false positives) also did not differ significantly (original p. 294, Tables 1 and 2). Original Fig. 2 shows an arthroscopically normal ACL that appeared thickened with increased signal on orthogonal planes and was misdiagnosed as a partial tear, yet appeared intact on the oblique planes. The study was retrospective; mean interval from MRI to surgery was 75 days; 10 partial and 30 complete tears were pooled; reading was by consensus; oblique planes had no interslice gap whereas orthogonal planes had a 1 mm gap, a difference that may have contributed some of the gain (original pp. 292, 296). What this study supports is that the main effect of oblique supplements is to reduce misdiagnosis of a normal ACL as torn; whether a second oblique plane adds further gain, this sample was too small to determine.
Ng AW et al. (2013) added an oblique axial plane perpendicular to the ACL at 3 T; of 61 cases, arthroscopy confirmed partial tear in 15. Reading conventional three-plane images alone, sensitivity for partial tear was 33% (5/15); after adding the oblique axial it was 87% (13/15), with specificity 87% in both; diagnosis changed because of the oblique axial in 8 cases, all to the correct diagnosis (original p. 212, Table 2). These are the clearest data in this chapter's material for oblique planes improving partial-tear recognition. The magnitude of the increase is uncertain in three respects: the two readers first read conventional images and then combined the oblique axial, so the second reading may have been influenced by reading order and memory of the first judgment; in-plane voxel area on the oblique axial was about one third that of conventional sagittal images, so improvement cannot be attributed entirely to plane; arthroscopists knew the MRI result, so the reference standard may have been biased toward MRI findings (original pp. 210–211). When bundles were scored separately, AM-bundle partial tear occurred in 7 knees and PL-bundle partial tear in 10, with both bundles partially torn in 2 knees (original p. 212, Table 1); such numbers are insufficient to estimate per-bundle diagnostic performance (original Table 2). The authors also considered that distinguishing complete from high-grade partial tear may have little therapeutic meaning (original p. 215).
Kosaka et al. (2014) compared three combinations—conventional sagittal (4 mm), plus oblique sagittal, and plus oblique coronal (both 2 mm)—for judgment of tear and stump in 54 cases. After adding oblique coronal, sensitivity for stump recognition rose from 46% to 69% and specificity for tear diagnosis from 77% to 94% (original Tables 1 and 2). These results came from specific reading conditions: an experienced orthopedic surgeon preselected from each sequence one image that "best displayed the ACL or stump"; with conventional sagittal alone that single image was read, and each oblique combination added one image from the new sequence; whether the selector was one of the three readers and whether the selector knew arthroscopic findings are not stated; the control was conventional sagittal alone, with different slice thickness from the oblique planes; results of the three readers were pooled without statistical comparison (accepted manuscript Methods and Tables 1 and 2). The reported increases cannot be applied directly to everyday full protocols. The paper's figures have practical value: the oblique coronal plane is nearly perpendicular to the femoral attachment surface, and whether the stump attaches to the lateral femoral condyle at a low position or to the PCL is most readily recognized in this plane (original Fig. 3).
Park et al. (2014) retrospectively studied 114 arthroscopy patients (1.5 T in 46, 3 T in 68—different patients); beyond conventional three planes they added oblique sagittal (parallel to the medial face of the lateral femoral condyle on coronal images) and oblique coronal (parallel to the notch roof on sagittal images), all sequences 3 mm thick with 0.3 mm gap (original Tables 1 and 2). Arthroscopy showed ACL tear in 76, including 52 double-bundle and 24 single-bundle tears (AM 18, PL 6) (original p. W202). The performance figures cannot be used: Tables 4 and 6 are labeled "diagnosis of single-bundle tear," yet at both field strengths the sensitivity denominator is 41 and specificity denominators are 5 and 27, totaling 82 positive and 32 negative—neither equal to 76 tears and 38 intact nor to 24 single-bundle tears—and the paper provides no cross-tabulation by normal, AM, PL, and double-bundle tear (original pp. W203–W204, calculated from the published tables). The text states that accuracy differences among combinations at 3 T were not statistically significant, yet Table 5 shows P = 0.003 and 0.013 for conventional versus all sequences (original p. W203). Reading followed a fixed order of conventional, oblique alone, then all sequences; the authors acknowledge that readers could recognize the added sequences, and surgeons may have known MRI results (original pp. W201, W206). What can be used are case observations: original Fig. 3 shows a case judged double-bundle tear on both conventional and oblique sagittal images; oblique coronal showed an intact AM bundle, and arthroscopy confirmed isolated PL tear (original p. W204); meanwhile, of 24 single-bundle tears, 8 (AM 5, PL 3) were still judged double-bundle tear on conventional images and after reading all oblique planes (original p. W203). The paper does not separately state funding or conflicts of interest.
The core claims of the next three studies are unsupported by their data: Gokalp et al. that oblique coronal can grade injury of both bundles; Ghasem Hanafi et al. that adding oblique sagittal has high sensitivity and specificity; Nenezic et al. that both supplements are more sensitive for partial tear.
Gokalp et al. (2012) reported that 1 mm oblique coronal proton-density–weighted images raised sensitivity for ACL tear from 37% to 74% and lowered specificity from 96% to 91% (original Table 3). The control was a set of 3 mm sagittal images only, without conventional coronal or axial planes; the authors state that the purpose was to emphasize "the insufficiency of conventional sagittal images" (original pp. 2360, 2363); slice thickness, matrix, and number of signal averages of the new sequence also differed from the control, biasing the comparison toward the new method. Tear counts are inconsistent: Abstract and Results write 24, yet the bundle breakdown (isolated AM 4, isolated PL 3, both 20) sums to 27, and Table 3 sensitivities of 37.04% and 74.07% also use a denominator of 27 (10/27, 20/27). The claim that oblique coronal can grade injury of both bundles has no basis: in grading Table 4, multiple values such as AM grade I sensitivity 50% (5 cases at that grade) and PL grade I sensitivity 61.22% (4 cases) cannot be obtained from the reported case counts (original pp. 2360–2361, calculated from the published table). Table 3 results judging each bundle as torn or not can be recalculated from the counts: oblique coronal sensitivity and specificity were 19/24 and 24/26 for the AM bundle and 18/23 and 24/27 for the PL bundle (original Table 3); these were not compared with conventional sequences and reflect only oblique coronal performance itself. Of 19 "equivocal tears" on sagittal images (8 intact and 11 torn at arthroscopy), most were clarified on oblique coronal images (original p. 2360).
Ghasem Hanafi et al. (2018) compared orthogonal planes, plus oblique sagittal, and plus oblique coronal, concluding that adding oblique sagittal is "accurate, with high sensitivity and specificity." Original Table 1 contradicts this: of 12 intact ACLs, the three methods correctly diagnosed 2, 3, and 3, respectively; specificity for any tear was 17%, 25%, and 25%, with κ versus arthroscopy of 0.15, 0.34, and 0.29 (original p. 283). With or without oblique planes, the great majority of intact ACLs were misdiagnosed as torn; the authors' conclusion of good diagnostic performance contradicts their own data. Partial-tear data in Table 1 show that after adding oblique sagittal, detection among 34 partial tears rose from 30 to 33, while 9 of 17 non–partial-tear knees were still misdiagnosed as partial tear (original p. 283, Table 1): the sensitivity gain came with many false positives. Inclusion criteria listed "decreased level of consciousness, hypoxemia, airway obstruction" as clinical situations requiring arthroscopy (original p. 282)—unrelated to knee injury—so how this cohort was selected cannot be judged.
Nenezic et al. (2013) added oblique sagittal and 17° flexed-knee scanning to conventional three planes in 149 trauma patients and claimed both supplements were "more sensitive (P < 0.001)" for partial tear. There was no arthroscopic or other reference standard, and readers had seen history and examination findings (original pp. 21, 24). Both supplements diagnosed tear in all 149 cases; all 15 cases called normal on conventional scanning were reclassified as partial tear (original Table 2). Without a reference standard, this change is only an increase in positive rate and cannot be called increased sensitivity. Technical data can be used: mean number of slices displaying the full ACL length was 3.8 on oblique sagittal and 2.7 with the flexed technique; oblique sagittal required no repositioning and took 7.9 min total, whereas the flexed technique including repositioning took 9.8 min (original Table 5).
Li et al. (2023), at 1.5 T with a single-channel knee coil, added to conventional sequences (4 mm) a 2.3 mm contiguous oblique sagittal fat-suppressed proton-density–weighted sequence prescribed along the ACL on axial and coronal images (3 min 24 s); 42 cases had arthroscopic reference (2 normal, 3 grade I, 13 grade II, 24 grade III) (original p. 2, Table 1). The Abstract states that after adding the new sequence, positive predictive value for grade II injury rose from 53.9% to 92.3% (reader 1) and from 69.2% to 84.6% (reader 2). This misreads their own data: original Table 3 swaps the names of sensitivity with positive predictive value and of specificity with negative predictive value; the supplementary table listing true positives, false negatives, false positives, and true negatives for each group confirms that the labels are swapped in all 12 sets of values (original p. 7, Table 3 and supplementary table). For reader 1 on conventional sequences for grade II, true positives 7, false negatives 6, false positives 1, true negatives 28 yield sensitivity 53.8% (7/13) and positive predictive value 87.5% (7/8). With corrected names, after adding the new sequence sensitivity for grade II rose from 53.8% to 92.3% (12/13) for reader 1 and from 69.2% to 84.6% (11/13) for reader 2; positive predictive value was essentially unchanged for reader 1 (87.5% versus 85.7%) and rose from 75.0% to 84.6% for reader 2; among 18 knees without a complete tear, reader 1's misdiagnoses as complete tears fell from 6 to 1 (calculated from the supplementary table).
These improvement figures have further problems. Both readers first read conventional sequences and then combined the new sequence (original p. 3); the two readings are not independent. McNemar–Bowker tests in original Table 2 compare symmetry of each reading versus arthroscopy, between the two readings, and between the two readers; weighted κ is reported separately for each; these tests do not answer how much adding the new sequence improved diagnostic accuracy, and differences among κ values were not compared (original Table 2). MRI grading and arthroscopic grading (American Academy of Orthopaedic Surgeons criteria) use different definitions; their "grade I" is not the same injury; arthroscopists knew MRI results; only 2 ACLs were normal, both readings called them normal, and specificity 2/2 has an approximate 95% CI of 16%–100% (calculated from the published numbers)—insufficient to estimate discrimination of injury versus no injury (original pp. 3–4, 8). The study was funded by the National Natural Science Foundation of China; the authors declare no competing interests (original p. 9).
The partial cruciate-tear imaging review by Dos Reis Morimoto et al. (2026) recommends in its Table 1: oblique sagittal and oblique coronal along the ACL at ≤2 mm, three-dimensional isotropic sequences ≤1 mm, plus lateral-decubitus maximal-flexion sagittal images (original pp. 1802–1804 and Table 1). The review states that adding oblique sagittal and oblique coronal "significantly improves" diagnostic accuracy for partial and single-bundle injury, citing Li et al. (2023) and Park et al. (2014): Li et al.'s grade II detection increase can be read only after correction from the supplementary table, and Park et al.'s performance-table denominators do not match the case mix; oblique slice thicknesses in the two studies were 2.3 mm and 3 mm, and neither compared different thicknesses. Thin-slice oblique imaging is sound on imaging grounds, and ≤2 mm can be offered as a technical suggestion, but that specific value has not been verified in a controlled study. Claims about lateral-decubitus flexion and three-dimensional curved reconstruction are discussed under Xu Z et al. and Zhang et al. below. The review declares no funding and no conflicts of interest (original p. 1810).
In the routine protocol the sagittal plane should be prescribed parallel to the medial face of the lateral femoral condyle, as the ESSR reference protocol already specifies; in Kwon et al.'s data, adding that oblique sagittal alone reduced false positives from 10 to 3. When the femoral end remains unclear on routine images, or when stump and single-bundle status must be judged, add one oblique plane directed at the specific question, taking about 3–6 min: choose oblique coronal to observe the femoral end and stump attachment site, and oblique axial to separate the two bundles. Controlled data for oblique planes recognizing partial tears and judging injury by bundle come from Ng AW et al. (2013) and from Li et al. (2023) after supplementary-table correction—15 and 13 partial tears, respectively—with detection increased after the supplement; both studies read conventional images first and then combined the new sequence, so the exact size of the increase cannot be determined. In Park et al.'s cases, oblique coronal can display a preserved bundle, yet 8 of 24 single-bundle tears were still judged double-bundle after reading the oblique planes; oblique planes do not guarantee identification of which bundle is torn.
Flexed-Knee Scanning
After flexion the ACL moves away from the notch roof and partial volume around the femoral end decreases; image findings are consistent across studies.
Muhle et al. (2013) performed sagittal scanning at extension, about 30°, and about 55° of flexion at 1.5 T in 40 patients 1–9 days after injury. Extension used a standard knee coil; flexion used a nonmagnetic positioning device and two circular flexible surface coils. Because of pain, effusion, and leg length, the two flexed angles were actually 28°–43° and 52°–72.5° (original pp. 2–4). Femoral-end display was rated improved in 50% at 55° and 35% at 30° (original Table 2). Twenty-nine underwent arthroscopy (8 partial, 20 complete, 1 intact); partial-tear detection rose from 4/8 in extension to 5/8 in both flexed positions, and complete-tear detection from 17/20 to 19/20 at 55° (original Table 3). The table prints 17/20 as 83% and 19/20 as 93%; the correct percentages are 85% and 95%. Arthroscopy was performed only when MRI suggested tear; the other 11 had no arthroscopy. The single arthroscopically intact ACL was an MRI-diagnosed tear that was not confirmed; the table does not list each position's reading for that case, and the authors give no specificity (original pp. 6–7 and Table 3 note). Position and coil changed together; diagnostic differences were not tested statistically. Original Table 1 lists sagittal images as proton-density–weighted (TE 20 ms), yet the Abstract and figure legends say T2-weighted (2900/90); which sequence was used cannot be determined. The study confirmed improved femoral-end display with flexion; the increase in detections was small and untested statistically and cannot be used to estimate the gain in diagnostic performance.
Gunaydin et al. (2019) studied prone maximal flexion (mean 124.5°, range 104°–145°). All 61 included cases had been diagnosed as "partial tear" on conventional supine extended MRI and also required arthroscopy for meniscal or cartilage lesions (original p. 143), so the conventional MRI diagnosis was "partial tear" in every case; the paper compared agreement of both examinations with arthroscopy by intraclass correlation coefficient and obtained 0.000 for conventional MRI (original p. 144)—a result determined by the selection method and unrelated to the diagnostic ability of extended MRI, and in any case the ICC is not appropriate for three-category judgments. Results and Discussion contradict each other: Results state that 5 partial tears were PL rupture with intact AM, whereas Discussion states that no case had PL rupture with intact AM (original pp. 144, 146). Legends to original Figs. 3–8 were erroneous and have been corrected by a corrigendum (Gunaydin et al., 2020). Usable results are: among knees diagnosed "partial tear" on conventional MRI and selected for surgery, arthroscopy found 20 (33%) intact ACLs, 27 partial tears, and 14 (23%) complete tears; in this selected series, prone flexed MRI agreed better with arthroscopy, with sensitivity 36/41 and specificity 20/20 for recognizing tear (original Table 1). The interval between the two MRIs was not uniform, and a single reader interpreted both (original pp. 143, 146).
Xu Z et al. (2021) studied 204 patients more than 6 weeks after injury with clinical suspicion of partial tear; besides conventional 3 T scanning in supine extension, they added lateral-decubitus maximal-flexion scanning with a shoulder flexible coil wrapping the knee and an oblique coronal T2-weighted fat-suppressed sequence parallel to the ACL (original pp. e932228-2 to -4). With arthroscopy as reference, partial-tear detection was 69/86 with the flexed protocol and 42/86 with the conventional protocol (original Tables 1 and 2); calculated from these 2×2 tables, overall accuracy was 89.2% for the flexed protocol and 72.1% for the conventional. Printed accuracies in Table 3, the time-course grouping in Table 4, and complete-tear results in Table 5 cannot be used. Printed accuracies in Table 3 (conventional 63.51%, flexed 87.85%) do not match their 2×2 tables. Table 4, which supports "greatest improvement in the intermediate group," cannot be obtained from the reported group sizes: the chronic group totaled 74, yet conventional specificity of 93.83% cannot be any integer ratio within 74; flexed sensitivity in the three groups was 34.28%, 94.44%, and 44.68%, and even if all 58 in the intermediate group were partial tears, total true positives across groups would be at most about 67, short of the 69 in Table 1 (calculated from the published table). Exclusion criteria state that complete tears were excluded, yet Table 5 lists 89 arthroscopically confirmed complete tears of unexplained origin (original pp. e932228-2, -5 to -6). Position, coil, and scan plane changed together; paired data were analyzed with chi-square tests; whether conventional and flexed images were read separately is not stated. Another 32 acute patients could not complete flexed scanning because of swelling and pain (original p. e932228-6). The overall 2×2 tables support increased partial-tear detection after adding lateral-decubitus flexion and oblique coronal imaging; the staging conclusion has no basis. Dos Reis Morimoto et al. (2026) cite this to conclude that lateral-decubitus maximal flexion is especially suited to chronic or intermediate injury (original p. 1802 and Table 1), resting precisely on this untenable grouping table.
Chen et al. (2024) first determined the flexion angle at which the ACL is straightest in 50 healthy volunteers (mean 30.3°), then compared 1.2 mm oblique coronal imaging at 30° flexion with conventional extended scanning at 3 T in 92 patients a mean of 4.2 days after injury; arthroscopy confirmed tear (including partial) in 59 and no tear in 33; sensitivity was 94.9% versus 76.3% and specificity 97.0% versus 81.8% for flexed versus conventional protocols (original Table 4). Between protocols, flexion angle, scan plane (oblique coronal versus sagittal), slice thickness (1.2 mm versus 3.5 mm), number of signal averages (5 versus 1), and weighting all changed; the control diagnosis was "based mainly on sagittal T2-weighted sequences," and its 76.3% sensitivity is below the pooled values of the two meta-analyses (original p. 3). Inclusion criteria write "arthroscopically confirmed ACL tear," yet Results include 33 without tear (original p. 2, Table 4). Calculated from Table 4's binary results, AUCs for the two protocols are 0.79 and 0.96, which do not match the reported 0.776 and 0.945 (calculated from the published table); the paper does not state what scoring was used for the ROC analysis, so the source of the difference cannot be judged and these two AUCs should not be used as evidence of gain. The third author is from Philips Healthcare and was responsible for "equipment parameter optimization"; the study used a Philips 3.0 T system, and the dynamic scanning device is a Chinese invention patent (original pp. 1, 2, 9). The flexed oblique coronal protocol outperformed its control, but the control was weak, and the gain cannot be attributed to 30° flexion alone.
In the author's view, the help that flexion gives ACL interpretation is clear. Paired observation by Niitsu et al. in the same coil and flexed scanning by Muhle et al. both recorded improved femoral-end display; when the stump is adherent to the PCL, about 20° of flexion can change the orientation of structures in the notch and reveal the stump–PCL relationship (Ng et al., 2011, p. 79). Flexed protocols of Muhle et al., Xu Z et al., and Chen et al. also detected more than conventional extension. Those protocols simultaneously changed coil, scan plane, slice thickness, or case selection; the optimal flexion angle and the independent contribution of flexion itself to diagnostic performance have not been determined—neither point undermines the conclusion of improved display. When the femoral end or stump is unclear on routine images and attachment of a chronic stump must be judged, and the patient can tolerate it, flexed scanning should be added; pain and effusion limit attainable flexion (Muhle et al., 2013; Xu Z et al., 2021).
Field Strength and Three-Dimensional Sequences
Van Dyck et al. (2013) is the only prospective study in this chapter's material that compared 1.5 T and 3 T in the same patients. Two hundred patients underwent both examinations in random order (mean interval 0.3 days); both systems used the same 8-channel knee coil, with thinner sagittal slices (2 mm versus 3 mm) and a larger matrix at 3 T; 100 underwent arthroscopy, including 25 ACL tears (21 complete, 4 partial) (original pp. 917–919 and Supplementary Table E-1). Reader sensitivity was 76% and 80% at 1.5 T and 80% for both at 3 T; specificity was 100% for both; AUCs were identical (reader A 0.900 versus 0.900; reader B 0.919 versus 0.919); all 4 partial tears were missed by both readers at both field strengths, most scored "definitely intact" (original Tables 1 and 2, Supplementary Table E-2). Limitations include that readers may have inferred field strength from image appearance and that arthroscopists knew MRI results (original p. 922). Under that study's protocols, 3 T showed no advantage over 1.5 T for diagnosing ACL tear.
Nouri et al. (2017) assigned 100 young trauma patients to 3 T (56) or 1.5 T (44) and claimed comparable performance for diagnosing complete tears (original p. 1). The groups were different patients; equipment came from two vendors; sagittal and coronal proton-density–weighted slices were 3 mm at 3 T and 4 mm at 1.5 T (original Table 1). Group counts also fail to match: in meniscus and PCL tables the 1.5 T column sums to 56 and the 3 T column to 44—the reverse of the Methods; the ACL row sums to 58 and 38, matching neither grouping (original Tables 2 and 5, calculated from the published tables). The ACL 2×2 tables therefore cannot be verified; neither field strength's ACL diagnostic results can be used, still less for a field-strength comparison. Their protocols are useful for reference: both field strengths added 2 mm axial fat-suppressed and 2 mm oblique axial proton-density–weighted images (original Table 1).
Al Mohammad and Gharaibeh (2024) write that accuracy for partial tear is 25%–53% at 1.5 T or lower and can reach 95% at 3 T (original p. 234). These two figures cannot be compared that way: 25%–53% comes from Van Dyck et al. (2012) and is the proportion diagnosed as partial tear among 51 cases that were all partial tears, of which 14 were themselves imaged at 3 T; 95% comes from Van Dyck et al. (2011) and is overall accuracy in 172 cases (132 with intact ACL). When the same group directly compared both field strengths in the same patients, all 4 partial tears went unrecognized at both (Van Dyck et al., 2013).
The question for three-dimensional sequences is whether they can replace two-dimensional sequences. Kijowski et al. (2009) added a 0.7 mm isotropic three-dimensional fast spin-echo sequence (5 min) at 3 T in 100 arthroscopy patients and compared it with a conventional two-dimensional protocol of about 25 min that included 2 mm coronal and sagittal intermediate-weighted images: of 36 ACL tears (33 full-thickness, 3 partial), both methods had sensitivity 100% and specificity 98.4% (original Table 3, p. 492). Both approach the ceiling: in this cohort three-dimensional performance for ACL tear was similar to the conventional protocol and does not show superiority; reading order was conventional first then three-dimensional, not randomized, and surgical decisions rested on the official conventional report. The authors conclude that three-dimensional sequences can provide rapid assessment for patients who cannot tolerate a 25-minute examination, and that whether they can replace two-dimensional sequences in all patients still needs study (original p. 494). One author was employed by GE Healthcare and another received GE research funding; both were disclosed (original p. 487). Chagas-Neto et al. (2016) compared a 5-minute three-dimensional sequence with an 8 min 13 s 4 mm two-dimensional protocol at 1.5 T; 38 patients underwent arthroscopy within 3 days of MRI, with 28 ACL tears; sensitivity was 93% for both and specificity 80% versus 85% (original Tables 1 and 3); the authors likewise did not recommend immediate replacement of conventional two-dimensional protocols by three-dimensional sequences (original p. 74).
Shakoor et al. (2019) pooled 22 studies: for ACL injury, pooled sensitivity and specificity were 91.2% and 95.2% for three-dimensional sequences and 90.7% and 96.3% for studies that also reported two-dimensional results, with no statistically significant difference (original Table 3). The Abstract also states that "3 T improved the diagnostic performance of three-dimensional MRI," based on a sixfold difference in diagnostic odds ratio between 10 studies at 3 T and 12 at 1.5 T or below (original Table 4). That is a between-study comparison: the latter group includes several studies from 1988–2004 performed with gradient-echo sequences on 0.2–1.5 T systems—different eras, sequences, and reading conditions; the pooled 2×2 tables also merge both readers' judgments, for example recording Kijowski et al. as 72 true positives and 126 true negatives—100 patients × 2 readers (original Table 2). That conclusion cannot guide choice of field strength.
Prabakar et al. (2025) claim that 3 T three-dimensional sequences "significantly improve both sensitivity and specificity"; that conclusion cannot be used. The 30 cases were a convenience sample; arthroscopy served as reference "when feasible," cases without arthroscopy were retained in the analysis, and the number that underwent arthroscopy is not stated (original p. 2). The paper reports no specificity and performs no statistical test. Text and tables contradict each other: the text says partial-tear detection rose from 87.5% to 95.8%, yet there were 8 partial tears, so 95.8% is impossible, and Table 3 writes 100%; for PCL partial tear the text writes 83.3% with 3 cases, Table 3 66.7%; scan-time savings are written as about 25% in one place and 40%–50% in the Abstract and Conclusions (original pp. 1, 3–5). There were 4 complete ACL tears, all detected by both methods; the partial-tear difference was 1 of 8.
Zhang et al. (2019) used a 3 T three-dimensional FIESTA sequence (0.6 mm contiguous, 4 min 53 s) on the right knee of 40 healthy volunteers to perform curved planar reconstruction along the ACL and rotated the reconstruction direction at 30° intervals from 0° to 180° (7 directions); the comparator was a set of 3 mm oblique sagittal spin-echo T1-weighted images with 1 mm gap (original pp. 47–48). On curved reconstruction the femoral end, midsubstance, and tibial end of the ACL were each visible in 40/40 and both bundles in 32/40; on oblique sagittal T1-weighted images the corresponding figures were 10/40, 16/40, 40/40, and 0/40 (original Table 1). These counts support the feasibility of curved reconstruction for displaying the full length and two bundles of a healthy ACL. Reported signal-to-noise ratios, contrast-to-noise ratios, and "superior" proportions cannot be used. Methods define SNR and CNR with bone, muscle, and air (original p. 48, formulas 1–3 and Fig. 4), yet Results report ACL SNR and ACL-versus-joint-fluid CNR—measurement objects that do not match. The Abstract states that curved reconstruction was "superior" to T1-weighted images in 60%–85% of cases, yet Methods define only visible versus not visible and do not report how superiority was judged. These proportions cannot be derived from visibility counts in Table 1; at the tibial end both methods were visible in 40/40, so the basis for 60% "better" cannot be checked. Methods mention κ for interreader agreement, yet Results report no κ (original p. 49). The comparator was T1-weighted images alone, not a complete multiplanar clinical protocol, and the authors state that performance for displaying injured ligaments remains undetermined (original p. 50). Dos Reis Morimoto et al. (2026) cite this study to support three-dimensional curved reconstruction "improving accuracy in complex or uncertain cases" (original p. 1804), beyond what a healthy-volunteer study can show. The authors declare no conflicts of interest (original p. 46).
For diagnosing ACL tear, switching to 3 T or a three-dimensional sequence should not precede checking prescription and image quality (see below): in within-patient comparisons, changing field strength or switching to three-dimensional sequences left ACL-tear diagnostic performance similar to the original protocol, whereas oblique prescription reducing false positives has controlled data from Kwon et al.; the relative size of each factor's effect has not been compared directly. The practical advantages of three-dimensional sequences are time savings and arbitrary oblique reconstruction, suited to patients who cannot tolerate long examinations. For partial tears, reliable material separately comparing three- and two-dimensional sequences for partial tear is insufficient: among Kijowski et al.'s 36 tears only 3 were partial, and Prabakar et al.'s comparison of 8 is unreliable; in Shakoor et al.'s pool, 3 studies separately reported complete and partial results, with pooled three-dimensional sensitivity for partial tear of 70% (95% CI 42%–90%) (original p. 1547 and p. 1557, Table 4).
Interpretation When Image Quality Is Inadequate
When a report states "ACL poorly visualized" or "possible tear," first distinguish ligament abnormality from technical factors: whether the sagittal plane follows the medial face of the lateral femoral condyle, on how many slices the ACL appears, what the slice thickness and gap are, whether fat suppression is uniform, and whether motion artifact is present. "Abnormalities" caused by technical factors usually appear on a single slice of a single sequence and disappear when another plane is used (Section 6). In that situation first add an oblique plane along the ACL or flexed-knee imaging; repeating the examination on a higher-field system shows no diagnostic gain in the available controlled material.
3. Interpreting Complete Tears
The Normal ACL
The ACL arises from the posterior part of the medial face of the lateral femoral condyle (lateral wall of the intercondylar notch), runs obliquely anteroinferiorly, and inserts on the anterior intercondylar area of the tibia; by tibial insertion it is divided into an anteromedial (AM) and a posterolateral (PL) bundle, with the femoral AM attachment more proximal and the PL more distal. Ng et al. (2011) cite anatomic data: ACL length about 38 mm and width about 11 mm; AM length 36.9 ± 2.9 mm and PL length 20.5 ± 2.5 mm (original p. 75).
On MRI a normal ACL appears as taut, continuous low- to intermediate-signal fiber bundles, parallel to or steeper than the notch roof line (Blumensaat line); PL-bundle signal is usually higher than AM (Ng et al., 2011; Al Mohammad and Gharaibeh, 2024). On posterior coronal slices the low-signal ACL attaches to the medial face of the lateral femoral condyle, with fat between fiber bundles producing a fascicular appearance (Tung et al., 1993, p. 662 and Fig. 1). The ESSR 2024 recommendations specifically note that the ACL looks more striated than the PCL and should not be misread as a partial tear (Parkar and Adriaensen, 2024, p. 6596). A normal ACL can also appear attenuated on axial images: Roychowdhury et al. (1997) found waist narrowing on axial images in 34 of 143 (24%) arthroscopically confirmed normal ACLs; near the tibial insertion fiber bundles fan out with intervening fat and can show increased signal on axial images (original pp. 1489–1491). Five to ten percent of normal ACLs are poorly shown on conventional sagittal images (Al Mohammad and Gharaibeh, 2024, p. 235), usually because the sagittal plane fails to include the whole ligament or because of partial-volume averaging between the ligament and the lateral femoral condyle or surrounding fat (Tung et al., 1993, p. 661).
Direct Signs and the Femoral Attachment
The most reliable finding of complete tear is interruption of fiber continuity. Brandser et al. (1996) asked 3 readers to evaluate only the ACL itself with indirect signs masked; in discriminant analysis, fiber discontinuity was the highest-value direct sign; on fiber discontinuity alone, 93% of 34 acute complete tears were diagnosed as torn and 98% of 40 intact ACLs as intact (original pp. 123–124). Definitions of "discontinuity" vary: Brandser et al. also counted nonvisualization of fibers on sagittal or coronal images as discontinuity (original Table 1), whereas Lee et al. (1999) counted only a focal cleft or division of the ligament into two or more segments (original p. 699), so resulting sensitivities differ widely (Section 6, children). Van Dyck et al. (2011) defined complete tear as: all fibers interrupted, the ligament wavy or lax and no longer parallel to the Blumensaat line; complete absence or atrophy with horizontal or vertical abnormal course; or complete replacement of the ACL by an edematous mass (original p. 702).
To judge ACL absence, track femoral end, midsubstance, and tibial end slice by slice on contiguous images. Because the ACL runs obliquely, a slight change in knee position can leave a single slice including only part of the ligament (Brandser et al., 1996, p. 124). Tung et al. (1993) used the rule: diagnose tear only when signal and morphology meet tear criteria and no sequence shows a normal ligament; when appearance is abnormal but tear criteria are not met, record "equivocal" (original p. 662).
Judgment of the femoral end depends on a second plane (Fig. 3). On coronal images through the notch, absence of attached low-signal fibers on the medial face of the lateral femoral condyle, with only intermediate signal, is the empty-notch sign. Tung et al. (1993) reported that of 50 complete tears, 46 (92%) were diagnosed as torn on coronal images; of 52 normal-ACL examinations with coronal images available for review, 43 (83%) were diagnosed normal; of 10 tears missed or described equivocally on the original report, 9 showed tear on coronal review, and of 3 original false positives, 2 had normal coronal appearances (original pp. 663–666). Coronal counts in the tear group are inconsistent: 46 torn, 1 normal, and 4 equivocal sum to 51, more than 50, unexplained in the original. On axial images, Roychowdhury et al. (1997) found that 49 of 56 "cloudlike masses" (irregular intermediate- to high-signal masses replacing the ACL) were complete tears, and 16 of 19 with no ACL visible on axial images were complete tears (original p. 1489, table).
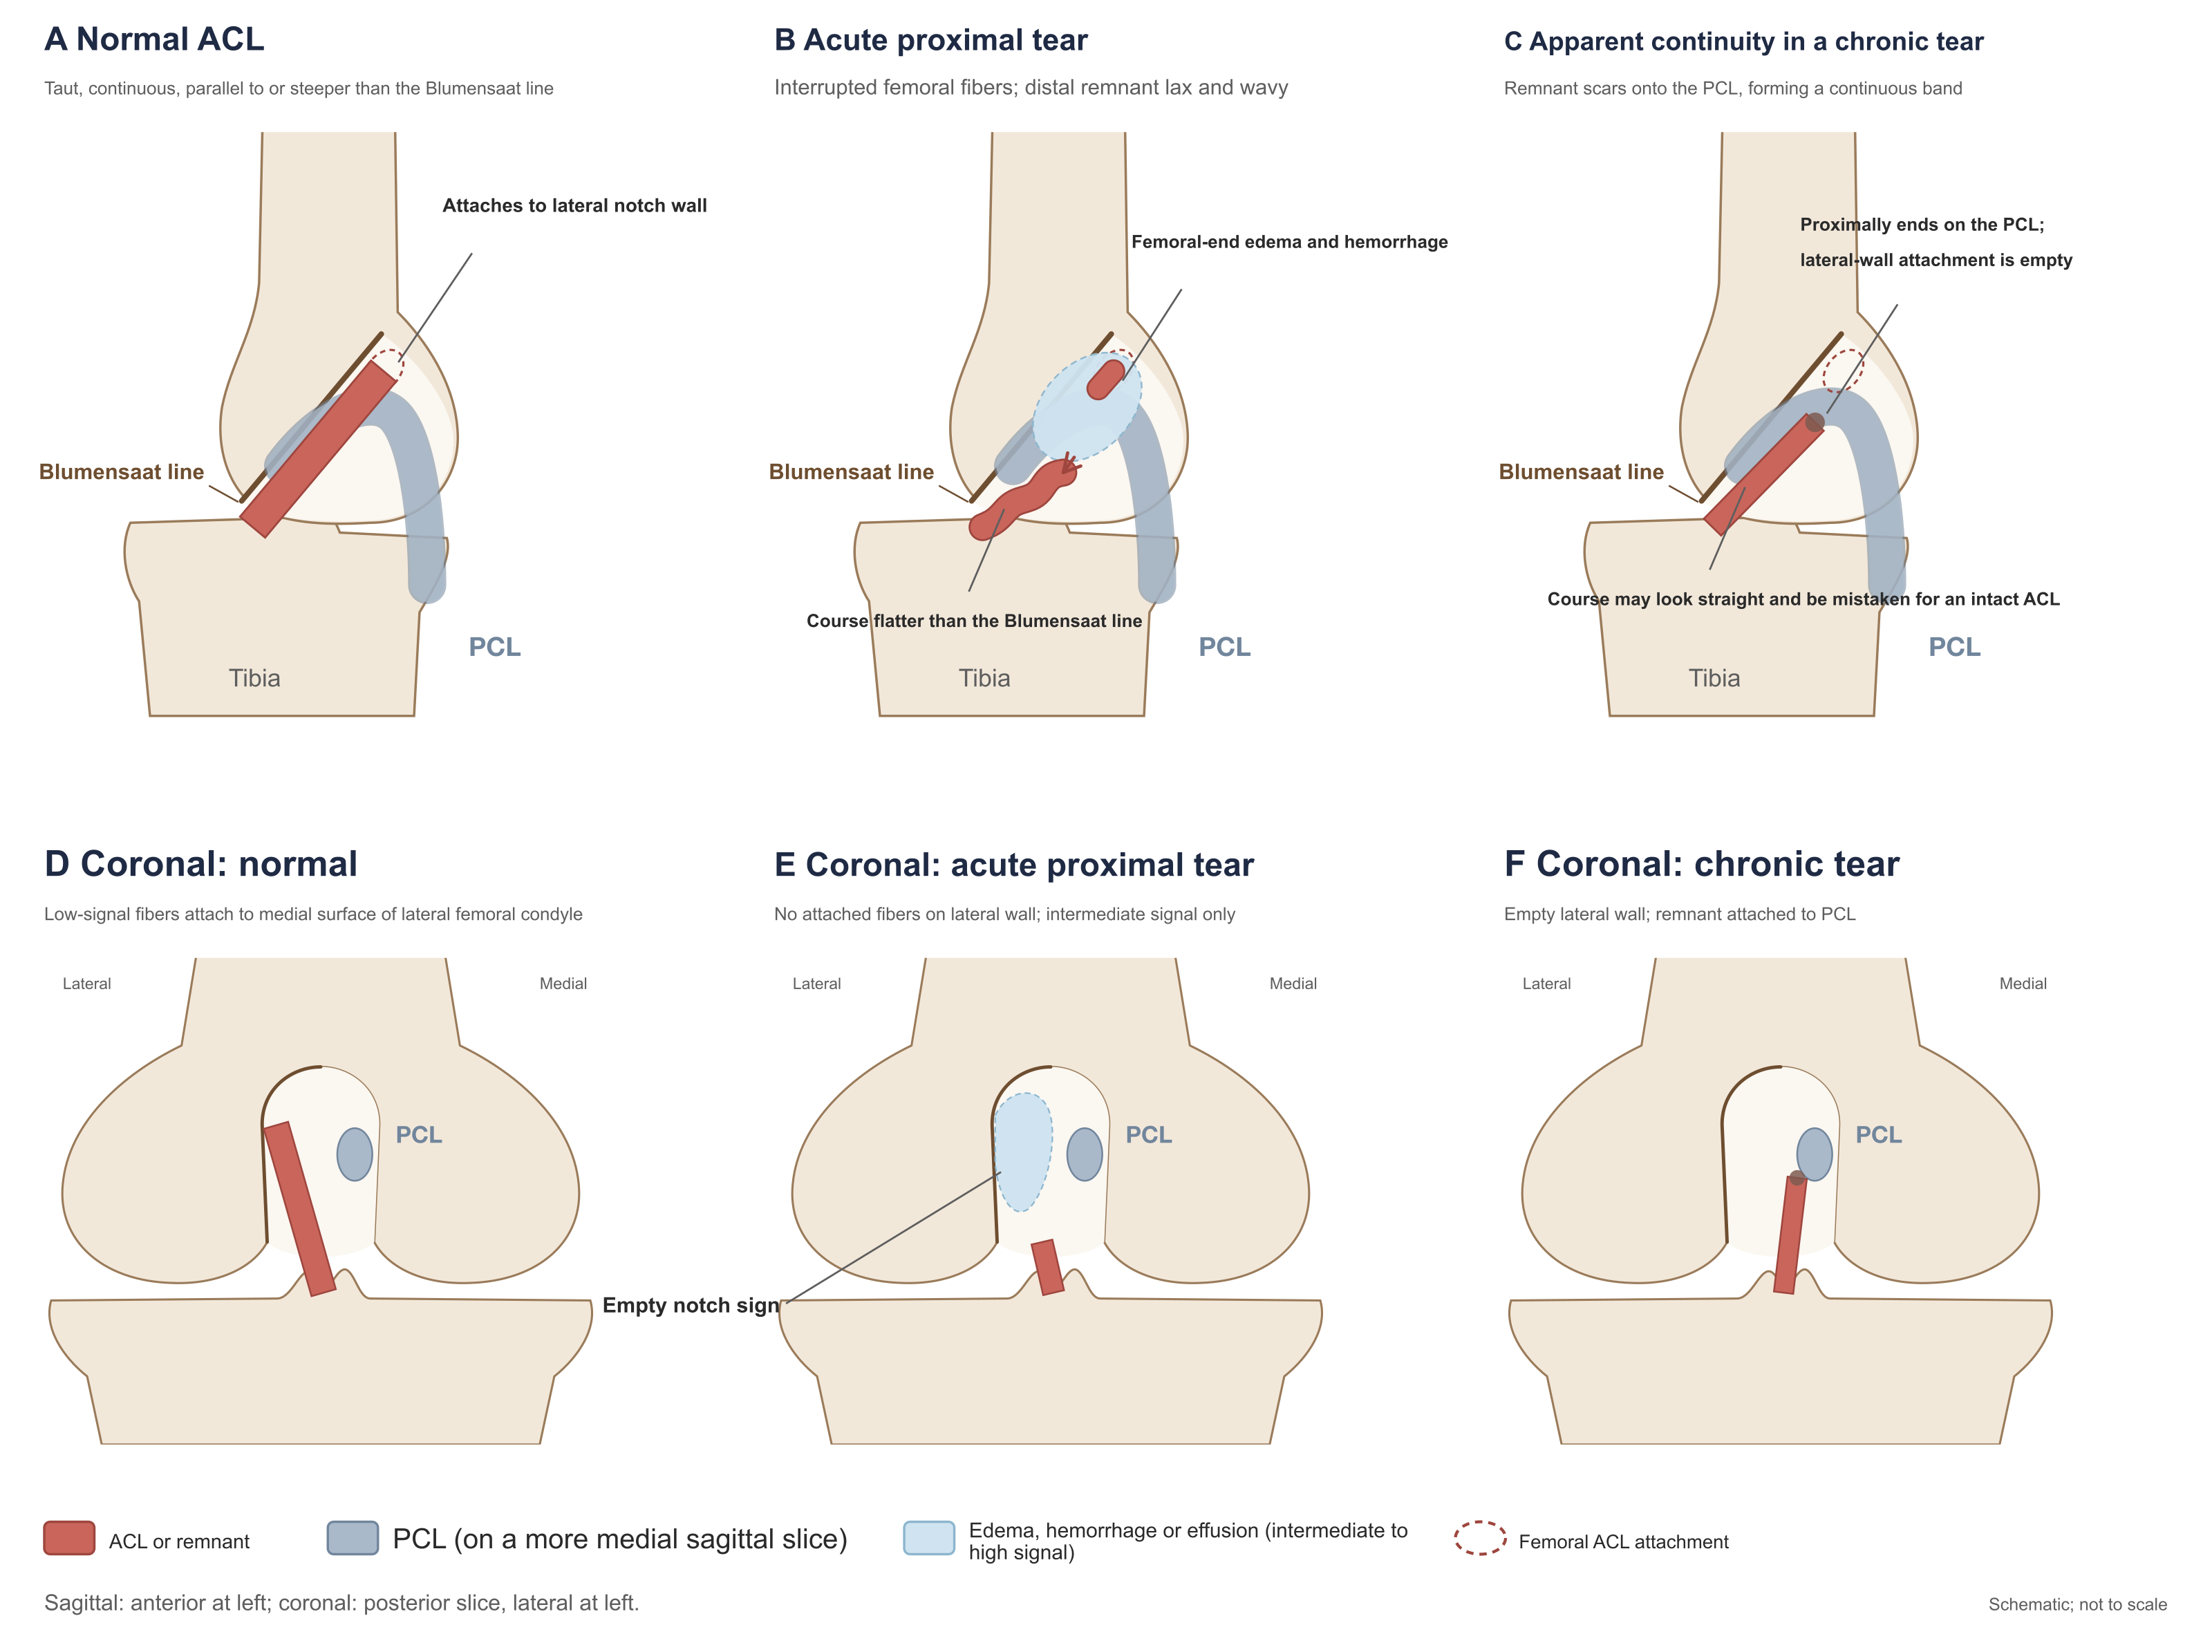
Figure 3. Sagittal and coronal appearances of the ACL: normal, acute proximal tear, and "false continuity" of a chronic tear.
A–C are sagittal; D–F are corresponding posterior coronal slices. When a chronic stump adheres to the PCL through scar tissue, sagittal images may show a relatively straight continuous low-signal band (C); interpretation must ask where the proximal end of that band terminates and confirm on coronal images whether fibers attach to the lateral wall (F). The PCL lies on more medial sagittal slices and is shown in lighter tone. Drawn from descriptions in Tung et al. (1993), Brandser et al. (1996), Vahey et al. (1991), Van Dyck et al. (2011), Dejour et al. (2013), and Ng et al. (2011).
After tear, residual fibers are often lax and wavy, with a course flatter than the Blumensaat line (Tung et al., 1993; Brandser et al., 1996). Such course abnormality can be measured, but methods and controls differ among studies and thresholds are not interchangeable: Celikyay et al. (2020) reported ACL angle 32° ± 7.1° for complete tear versus 45.1° ± 7.9° for mucoid degeneration, and Blumensaat angles 19.8° ± 9.4° versus 6.4° ± 8.5° (original Table 2); Başbuğ et al. (2026) reported ACL–lateral tibial plateau angle 26.3° ± 7.6° in complete tears versus 49.8° ± 3.5° in controls (original p. 3); Draghi et al. (2017), using <45° as threshold, found 86.4% of 22 acute tears below it versus 5% of 160 intact knees (original Table 2). Measurement is impossible when the ACL is completely absorbed or poorly visualized; when a chronic stump attaches to the PCL or notch roof, its direction depends on the attachment site.
Acute tears often show ligament thickening and edema, with diffuse high signal on T2- or proton-density–weighted images (Ng et al., 2011). Xu B et al. (2018) found diffuse high signal on T2-weighted images in 55.0% of 160 tears imaged within 6 weeks of injury versus 3.2% of 217 chronic tears (original Table 2). Comparison of acute edema with free joint fluid depends on the sequence used; see Vahey et al. (1991) in Section 5.
Increased signal alone cannot establish tear. Celikyay et al. (2020) found increased ACL signal on fat-suppressed proton-density–weighted images in all 37 complete tears and all 43 mucoid-degeneration knees (original Table 1); both of Van Dyck et al.'s (2011) 2 false-positive partial tears showed only mild intraligamentous high signal without fiber discontinuity or morphologic abnormality (original pp. 703, 707); Kwon et al. (2009) showed an arthroscopically normal ACL that appeared thickened with increased signal on orthogonal planes and was misdiagnosed as partial tear (original Fig. 2). Intraligamentous high signal may also come from mucoid and eosinophilic degeneration (Tung et al., 1993, p. 665) and from magic-angle effect on gradient-echo sequences (Umans et al., 1995).
Tear Location
When primary repair is considered, judgment of tear location has practical meaning, yet MRI reliability for this judgment is very low. Silverman et al. (2025) prospectively enrolled 174 complete tears imaged within 1 month of injury; surgery was performed 8–783 days after injury (mean 50.2 days); 2 musculoskeletal radiologists typed tear location on preoperative MRI by a modified Sherman classification and compared with intraoperative findings. Typing rests on the proportion of residual distal ligament relative to full length: type I femoral avulsion (distal remnant >90%), type II proximal tear (75%–90%), type III midsubstance, type IV distal tear (10%–25%) (original pp. 2–3 and Table 1).
| Type | Arthroscopy | MRI |
|---|---|---|
| I (femoral avulsion) | 46 (26.4%) | 17 (9.8%) |
| II (proximal tear) | 78 (44.8%) | 39 (22.4%) |
| III (midsubstance) | 44 (25.3%) | 117 (67.2%) |
| IV (distal tear) | 6 (3.4%) | 1 (0.6%) |
At arthroscopy 71% of tears were femoral or proximal, yet MRI assigned two thirds to midsubstance; overall agreement was 43.1% (75/174) (original p. 3, Fig. 1). The authors emphasize 95.5% agreement for type III, using arthroscopic type III as denominator (42/44); with MRI typing as denominator, only 42 of 117 MRI type III (36%) were type III at arthroscopy, and only 13 of 46 arthroscopic type I (28%) were correctly typed on MRI (calculated from original Table 2 and distribution counts). "High type III agreement" reflects MRI's tendency to call proximal tears midsubstance. Between MRI and surgery the stump may retract or adhere; surgeons were blinded to the study radiologists' typing but could view original MRI images and clinical reports (which usually do not state tear location); intraoperative typing was by 4 surgeons without assessment of intersurgeon agreement (original pp. 2–3, 6). Two authors disclosed research support, consulting, or educational support from Elite Orthopedics, Arthrex, and other companies (original p. 2).
Reviews commonly state that "about nine tenths of ACL tears are midsubstance" (Ng et al., 2011, p. 76); prior studies cited by Silverman et al. reported midsubstance tears in 38%–62%. Those proportions, and Silverman et al.'s MRI midsubstance rate (67.2%), all exceed the same cohort's arthroscopic rate (25.3%). Silverman et al. suggest that the difference may mainly reflect prior studies' reliance on MRI rather than arthroscopy for location (original p. 6); populations, typing criteria, and eras differ among studies, and that explanation has not been tested by direct within-patient comparison. When MRI is used to judge tear location with a view to primary repair, underestimation of proximal tears should be anticipated.
Indirect Signs
Indirect signs are changes outside the ACL that accompany tear: one class reflects the injury mechanism—lateral-compartment bone contusion, deep lateral femoral notch, and Segond fracture; another reflects anterior tibial translation relative to the femur after ACL failure—anterior tibial translation, uncovering of the posterior horn of the lateral meniscus, and PCL morphologic change (Tung et al., 1993, p. 661).
Brandser et al. (1996) retrospectively studied 74 arthroscopically confirmed cases (34 acute complete tears imaged within 6 weeks of injury, 40 intact ACLs); 3 readers read blindly in three sessions—indirect signs only, direct signs only, and both combined. AUC was 0.96 for direct signs alone and also 0.96 for both combined; for indirect signs alone it was 0.80 (original Table 2). In discriminant analysis, bone contusion had the highest value, followed by uncovering of the posterior horn of the lateral meniscus; on bone contusion and anterior tibial translation alone, 28 of 34 tears were diagnosed torn and 36 of 40 intact ACLs intact (original Table 3). In these 74 cases, adding indirect signs did not raise overall AUC; that is an overall comparison across all cases and does not mean indirect signs help no individual case. The authors state that all cases were acute complete tears and that if more cases with indeterminate direct signs were included, the incremental value of indirect signs would be greater (original p. 125). Tung et al. (1993) corroborate the role of indirect signs when direct signs are unclear: of 10 complete tears missed or described equivocally on the original report, all had at least one direct and one indirect sign on review (original p. 664).
Bone contusion. The typical distribution is marrow edema in the midportion of the lateral femoral condyle and the posterolateral tibial plateau together (Tung et al., 1993; Ng et al., 2011). Tung et al. (1993) best illustrate the relation of bone contusion to time since injury: regardless of site, 22 of 50 (44%) complete tears had bone contusion, as did 5 of 53 (9.4%) normal-ACL examinations; of 30 tears imaged within 9 weeks, 22 (73%) had bone contusion, versus 0 of 20 imaged after 9 weeks; lateral-compartment involvement occurred in 20 (40%) tears versus 2 (3.8%) normal examinations (original pp. 663–664 and table). Draghi et al. (2017) found lateral bone contusion in 18 of 22 (81.8%) acute tears imaged 5–34 days after injury versus 10 of 160 (6.3%) intact knees (original Table 2); Xu B et al. (2018) found femoral–tibial "kissing" contusions in 87 of 160 (54.4%) tears within 6 weeks versus none of 217 after 6 weeks (original Table 2). Bone contusion is not specific to ACL tear and can occur in intact knees of young people and children (Lee et al., 1999, p. 701; Ng et al., 2011, p. 80). Typical dual contusions within 9 weeks of injury support tear; absence of bone contusion more than two months after injury does not exclude tear.
Anterior tibial translation and uncovering of the posterior horn of the lateral meniscus. After ACL tear the tibia may translate anteriorly relative to the femur even in an unloaded scanning position. Vahey et al. (1993), on the midsagittal slice through the lateral femoral condyle, drew two lines parallel to the image's longitudinal axis, tangent to the posterior margin of the lateral femoral condyle and of the lateral tibial plateau, and measured the distance between them: intact ACL 0.8 ± 0.6 mm, acute tear 4.1 ± 1.0 mm, chronic tear 5.8 ± 0.7 mm (mean ± 2 SEM); at a 5 mm threshold, sensitivity 58% and specificity 93%; at 7 mm, sensitivity 38%, and none of 29 intact ACLs reached 7 mm (original pp. 817–819). The authors compared two line-drawing methods and two measurement slices and, when reporting thresholds, chose the method with the largest difference and easiest operation; selection and testing used the same dataset (original p. 818).
Reviews often state that anterior tibial translation beyond 7 mm "confirms" tear (Ng et al., 2011, p. 80; Al Mohammad and Gharaibeh, 2024, p. 237), based on Vahey et al.'s finding that none of 29 intact ACLs reached 7 mm. A 0/29 false-positive rate has an exact-method upper 95% confidence bound of about 12% (calculated from the published numbers); Lee et al. (1999) found anterior tibial translation of 7 mm and 10 mm in 2 of 24 children with intact ACL (original p. 701). The claim of "confirmation" has no basis. Specificity at a 5 mm threshold also varies with the control population: Draghi et al. (2017) found that 24 of 160 (15%) contemporaneous patients with intact ACL exceeded 5 mm (original Table 2). Anterior tibial translation reflects passive position during scanning and is affected by knee flexion–extension and rotation, muscle tension, and effusion; lack of translation does not exclude tear (Vahey et al., 1993, p. 819). Uncovering of the posterior horn of the lateral meniscus is another expression of anterior tibial translation: on sagittal images, a vertical line along the posterior margin of the lateral tibial plateau that intersects the posterior horn is positive; Tung et al. found this in 9 of 50 (18%) tears and in none of 53 normal-ACL examinations (original pp. 663–664).
PCL morphology and angle. After anterior tibial translation the PCL becomes more bowed. Definitions of PCL buckling vary in breadth: Vahey et al. (1993) counted a posteriorly convex sharp angulation as positive—none of 29 intact ACLs, 10 of 60 tears (original p. 818); Brandser et al. and Draghi et al. counted any concave segment of the posterosuperior PCL margin as positive—40.9% of Draghi et al.'s acute tears versus 1 intact knee (original Table 2). Tung et al. (1993) used a PCL bowing ratio threshold of >0.39—exceeded by 46% of tears and 2% of normal knees—a threshold chosen from the same dataset to reduce false positives (original pp. 664, 666). The PCL line sign is positive when a tangent to the posterior margin of the distal PCL fails to intersect the posterior femoral cortex within 5 cm of the distal femur (Brandser et al., 1996, Table 1)—positive in 45.5% of Draghi et al.'s acute tears versus 14.4% of intact knees (original Table 2). PCL-angle thresholds range from 96° to 115°; line-drawing methods, knee position during scanning, and control populations differ among studies, so a given PCL-angle value can be compared only with studies using the same drawing method and position; after complete tear the PCL angle decreases with time since injury (Yoon et al., 2013, Spearman correlation −0.567), but scanning position was not standardized in that series (original pp. 22, 24). Studies of PCL morphology for partial tear are in Section 4.
Other signs. The deep lateral femoral notch had no diagnostic value in Brandser et al.'s cases (original p. 125) and is hard to distinguish from the normal terminal sulcus without marrow edema; Celikyay et al. found depth >1.5 mm in 22% of complete tears (original Table 1). Segond fracture is closely related to ACL tear but uncommon—1 of Xu B et al.'s 377 tears (original Table 2); minimally displaced Segond fractures are easily missed on MRI and should be correlated with radiographs in acute trauma (Ng et al., 2011, Fig. 2; Parkar and Adriaensen, 2024, p. 6591).
Pericruciate Fat Pad Edema
The pericruciate fat pad lies in the notch between the femoral attachments of the ACL and PCL and is an intracapsular, extrasynovial structure. Draghi et al. (2017) first studied its diffuse signal increase as an indirect sign of ACL tear: among 182 subjects, all 22 acute tears (MRI 5–34 days after injury) showed fat-pad edema; among 160 intact knees, two readers called it positive in 44 (27.5%) and 40 (25.0%), mostly with meniscal lesions of varying degree, the rest with activity-related posterior knee pain (original pp. 2–4 and Table 2). Of the 22 tears, 6 lacked arthroscopic confirmation and were established by MRI findings of which "both doctors were 100% certain"; 4 cases with equivocal ACL appearance and no arthroscopy were excluded, while cases with unclear imaging but arthroscopic results could still be included—practices that bias the sample toward easily diagnosed cases (original pp. 2–3). With 22 tears, the lower 95% confidence bound on 100% sensitivity is about 85% (calculated from the published numbers).
Başbuğ et al. (2026) retrospectively studied 188 arthroscopically confirmed complete tears; 123 (65.4%) had fat-pad edema, versus none of 200 controls (original p. 3). Controls excluded acute trauma, bone contusion, surgically treated meniscal tear, ligament injury, significant cartilage lesions, and synovitis (original p. 2), so specificity for everyday reading is likely overstated; the authors also note that abnormal fat-pad signal can accompany meniscal tear, cartilage injury, and mechanical impingement (original p. 5). The Abstract states that "using 13 weeks after injury as cut-off, sensitivity rose to 85%, specificity and positive predictive value to 100%, and negative predictive value to 78%"; these figures cannot be cited as diagnostic accuracy. Methods do not state what variable predicted what outcome in the ROC analysis, and Results give neither counts before and after 13 weeks nor a 2×2 table. If the 200 controls remain true negatives, a negative predictive value of 78% corresponds to about 56 false negatives; sensitivity 85% means false negatives are 15% of all tear patients, so tear patients would number about 376 with about 320 true positives—yet the study enrolled only 188 ACL-tear patients (original pp. 1–3, calculated from the published numbers). The reported 188 patients and 200 controls cannot yield these figures; which subset was actually used and which number is wrong are not explained. Descriptive results can be used: all patients imaged within 12 weeks of injury had edema, after which the proportion declined gradually (original p. 3). Original Table 1 also swaps the definitions of the PCL line sign and PCL buckling rows; PCL buckling is recorded as positive in 31 controls in the text (original p. 3), yet Table 3 specificity of 86.50% corresponds to 27 (original p. 5, calculated from the published numbers)—these two PCL results from this study cannot be used.
Both studies jointly show that almost all acute tears imaged within weeks of injury have fat-pad edema; among intact ACLs in ordinary clinic populations the finding is present in about one quarter. Fat-pad edema in the acute phase can serve as an indirect sign supporting ACL tear but cannot alone confirm it. Absence of fat-pad edema in the acute phase makes acute complete tear less likely; Draghi et al.'s tear group numbered 22 and was biased toward easily diagnosed cases, and Başbuğ et al. do not give counts by time interval, so these data are insufficient to exclude tear on that point alone—and still less so more than three months after injury.
The Report by Bhinder et al. (2026)
Bhinder et al. (2026) report sensitivity 78.1% and specificity 77.8% for PCL angle at a 114° threshold, and sensitivity 81.3% for the PCL–posterior femoral cortical angle at 23.5°, and recommend incorporating these angles into routine MRI evaluation. The reference grouping cannot be verified: Methods state division by arthroscopy into 50 intact and 50 injured ACLs (original p. 1232), yet the Results 2×2 table has 63 abnormal and 37 normal (original p. 1237, Table 1); sensitivities of 78.1%, 81.3%, and 68.8% for the three angles cannot be obtained from either 50 or 63 and equal exactly 25/32, 26/32, and 22/32 (calculated from the published numbers); the title's "reliability" is unsupported by any agreement data in the paper; the intact-ACL group underwent arthroscopy for osteoarthritis or "suspected PCL change" (original p. 1232)—including such controls in a study that uses PCL morphology as an index directly affects the distribution of PCL angles. The angle diagrams in the paper (original Figs. 1, 3, 5) can serve as reference for measurement method.
Summary of Indirect Signs
The table below lists indirect signs in this chapter's material that have primary data; figures are positive rates in tear and control groups. Control positive rates depend on the control population: Draghi et al.'s controls were ordinary clinic patients who underwent knee MRI with intact ACL—closest to everyday reading; Başbuğ et al.'s controls excluded acute trauma and significant structural lesions.
| Sign | Criterion | Positive rate, tear vs control (study, control population) | Caveats in use |
|---|---|---|---|
| Lateral-compartment bone contusion | Marrow edema in the lateral femoral condyle or lateral tibial plateau | 40% vs 3.8% (Tung 1993, normal ACL; any-site bone contusion 73% within 9 weeks of tear, 0/20 after 9 weeks); 81.8% vs 6.3% (Draghi 2017, ordinary clinic patients); 68% vs 12.5% (Lee 1999, children) | Resolves with time; can occur with intact ACL, more often in children |
| Anterior tibial translation | On the midsagittal lateral femoral condyle slice, distance along the image longitudinal axis between posterior femoral and tibial margins | ≥5 mm: 58% vs 7%; ≥7 mm: 38% vs 0/29 (Vahey 1993, normal ACL); >5 mm: 54.6% vs 15% (Draghi 2017); >5 mm: 79.8% vs 7.5% (Başbuğ 2026) | Passive position, affected by posture and muscle tension; negative does not exclude; intact pediatric ACL can reach 10 mm |
| Uncovering of the posterior horn of the lateral meniscus | Vertical line at the posterior margin of the lateral tibial plateau intersects the posterior horn | 18% vs 0 (Tung 1993); 42% vs 4% (Lee 1999, children); 46% vs 7% (Celikyay 2020, mucoid degeneration) | Low occurrence among tears |
| PCL buckling | Posteriorly convex sharp angulation (Vahey); any concave segment of the posterosuperior margin (Brandser, Draghi) | 17% vs 0 (Vahey 1993); 40.9% vs 0.6% (Draghi 2017) | Definitions vary; judgment is subjective |
| PCL bowing ratio | x/y >0.39 | 46% vs 2% (Tung 1993) | Threshold chosen from the same sample; not validated |
| PCL angle | Angle between proximal and distal segment axes (or tangents) | <107°: 50.0% vs 14.4% (Draghi 2017), 84.6% vs 5.5% (Başbuğ 2026); <115°: reported sensitivity 74%, specificity 71% (Lee 1999, children; table counts do not match); ≤96°: 64.8% vs 9.3% (Celikyay 2020, mucoid degeneration) | Thresholds vary with drawing method, position, and population and are not interchangeable; decreases with time since injury (Yoon 2013; position not standardized) |
| PCL line sign | Tangent to the posterior margin of the distal PCL fails to intersect the posterior femoral cortex within 5 cm of the distal femur | 45.5% vs 14.4% (Draghi 2017); 68% vs 8% (Lee 1999, children) | Moderate occurrence among tears |
| Deep lateral femoral notch | Depression depth >1.5 mm | No diagnostic value (Brandser 1996); 22% vs 0 (Celikyay 2020, mucoid degeneration) | Low occurrence among tears; hard to distinguish from the normal terminal sulcus |
| Pericruciate fat pad edema | Diffuse high signal throughout the fat pad | 100% vs 25.0%–27.5% (Draghi 2017, 5–34 days after injury); 65.4% vs 0 (Başbuğ 2026) | Also common with meniscal lesions or posterior knee pain; resolves with time |
In the table, Vahey et al.'s 7% control positive rate at the 5 mm threshold is calculated from their 93% specificity; Lee et al.'s control positive rates are converted from the published specificities.
Clinical Use of Indirect Signs
In Brandser et al.'s acute complete tears in which direct signs could be evaluated, adding indirect signs did not raise overall diagnostic performance. Indirect signs are mainly for cases in which direct signs are unclear: typical lateral-compartment bone contusion within weeks of injury, together with anterior tibial translation ≥5 mm or uncovering of the posterior horn of the lateral meniscus, supports tear—these two classes were also the highest-value signs in Brandser et al.'s discriminant analysis. Negative findings for all of the above do not exclude tear: occurrence of each sign among tears is mostly 20%–80%, and bone contusion resolves with time; how much simultaneous negativity of several signs lowers the likelihood of tear has not been studied in this chapter's material. Specificity of measurement-based indices is lower in ordinary clinic populations than in "normal ACL" controls or in controls screened as in Başbuğ et al.: among Draghi et al.'s 160 intact knees, anterior tibial translation >5 mm, PCL angle <107°, and positive PCL line sign each occurred in 14%–15%.
4. Partial Tears, Isolated Bundle Injury, and Residual Fibers
Misdiagnosis of Partial Tears
MRI judgment of partial tear is the least reliable, with both missed and false-positive partial-tear diagnoses. For missed partial-tear diagnoses, Van Dyck et al. (2012) found that of 51 arthroscopically confirmed partial tears, two readers without knowledge of clinical or arthroscopic findings diagnosed partial or single-bundle tear in 25%–53%; the rest were diagnosed as complete tear, mucoid degeneration, or normal (original Table 1); Van Dyck et al. (2013) missed all 4 partial tears at both 1.5 T and 3 T (Section 2); of Dejour et al.'s (2013) 66 PL-bundle–preserving partial tears, 56 showed fiber absence or severe distortion on MRI and were indistinguishable from complete tear (original Table 5). For false-positive partial-tear diagnoses, of Gunaydin et al.'s (2019) 61 knees diagnosed "partial tear" on conventional MRI, arthroscopy found 20 (33%) intact ACLs and 14 (23%) complete tears (Section 2). That series was selected and the proportions cannot be generalized, but they suffice to show that an MRI report of "partial tear" cannot be taken as the diagnosis itself.
Definition of Partial Tear
What studies call a "partial tear" is not the same. At arthroscopy, Van Dyck et al. (2012) defined partial tear as "residual fibers connecting femur to tibia that resist deformation under probe tension" (original p. 257); Roychowdhury et al. (1997) defined unstable type by a positive Lachman or anterior drawer under anesthesia, or by need for reconstruction (original p. 1488); Chang et al. (2013) judged AM and PL bundles separately as complete tear, "attenuated" (continuous but without normal tension on probing), or intact (original p. 3285); Dejour et al. (2013) divided into PL-preserving, AM-preserving, and stump healed to PCL types and probed residual fibers for function (original pp. 493–494); Lee et al. (1999) defined partial tear as less than 90% of fibers ruptured at arthroscopy, still with clear resistance under probing, and mild pivot shift (original p. 698); Park et al. (2014) defined single-bundle tear as loss of continuity and tension in one bundle with the other intact (original p. W201); in the AAOS grading used by Li et al. (2023), grade I is a "sprain" with elongated ligament and a stable knee. The same name can mean a stable knee with only some fibers ruptured at arthroscopy, or a clinically unstable knee with one bundle intact and the other failed.
MRI diagnostic criteria are more consistent across studies—broadly continuous fibers with abnormal signal, continuous fibers with curved or wavy course, or partial fiber interruption with still-visible continuous fibers (Umans et al., 1995, p. 894; Van Dyck et al., 2011, p. 702); Van Dyck et al. (2012) also list fiber distortion without clear interruption, ligament attenuation, and abnormal course relative to the Blumensaat line (original p. 257).
Results of Individual Studies
| Study | Design and population | MRI and reading | Partial-tear n | Results |
|---|---|---|---|---|
| Umans et al. (1995) | Retrospective case–control; 13 each of partial, complete, intact | Field strength and sequences varied, including examinations performed at other hospitals; 3 readers × 2 readings | 13 | Sensitivity 0.35–0.75, specificity 0.62–0.89 (6 readings) |
| Roychowdhury et al. (1997) | Retrospective, 238 cases | 1.0 T or 1.5 T; axial images only; 2 readers by consensus | 28 (20 stable, 8 unstable) | Axial appearances of 17 stable cases fell in the same categories as normal ACL |
| Van Dyck et al. (2011) | Prospective, 172 cases (132 intact ACL) | 3 T; 2 readers by consensus | 17 | Sensitivity 77% (13/17), specificity 97% |
| Van Dyck et al. (2012) | Retrospective, all 51 partial tears | 1.5 T 37, 3 T 14; 2 readers each read blindly twice | 51 | Diagnosed partial or single-bundle tear in 25%–53% |
| Dejour et al. (2013) | Prospective, consecutive 300 with ACL insufficiency | 1.5 T, mostly ordinary knee protocols; read by operating surgeons | 123 | Fiber absence or severe distortion 92 (75%); continuous fibers visible 15 (12%) |
| Chang et al. (2013) | 77 knees undergoing reconstruction, per-bundle evaluation | 1.5 T with oblique coronal; 1 radiologist | — | AM judgment correct 91%, PL 78% |
| Ng AW et al. (2013) | Prospective, 61 cases | 3 T; conventional three planes then plus oblique axial; 2 by consensus | 15 | Sensitivity 33%→87%, specificity 87% |
| Van Dyck et al. (2013) | Prospective, same patients at 1.5 T and 3 T; 100 with arthroscopy | 2 readers, each blinded | 4 | All missed at both field strengths |
| Park et al. (2014) | Retrospective, 114 (1.5 T 46, 3 T 68, different patients) | Conventional three planes plus oblique sagittal and coronal, all 3 mm; 2 readers independently | 24 (single-bundle) | Performance-table denominators do not match case mix—cannot be used; 8 single-bundle tears judged double-bundle |
| Li et al. (2023) | Retrospective, 42 cases | 1.5 T; conventional then plus thin-slice oblique sagittal; 2 independently | 13 (arthroscopic grade II) | Grade II sensitivity: conventional 54%–69%, after adding 85%–92% (calculated from supplementary table) |
Umans et al. (1995) selected 13 partial tears from 217 arthroscopies at two hospitals and randomly matched 13 complete tears and 13 intact ACLs. Their conclusion—that MRI sensitivity for partial tear is insufficient to confirm the diagnosis without arthroscopy (original p. 893)—is supported by other studies; but the specific table figures cannot be used: possible sensitivities from 13 partial tears are discrete values such as 0.54, 0.62, 0.69, 0.77, yet Table 1's 0.75, 0.60, 0.35, and 0.40 cannot be obtained from 13, and the Abstract's lower bound of 0.40 is not the table's lowest value of 0.35 (original p. 895, Table 1, calculated from the published table). The paper's figure legends illustrate two misjudgments: a knee with AM rupture and intact PL at arthroscopy showed horizontal fiber course and anterior tibial translation on MRI, appearing as complete tear (original Fig. 4); a knee with 50%–70% fiber rupture at arthroscopy appeared intact on MRI and progressed to complete tear over 33 months (original Fig. 6).
Roychowdhury et al. (1997) judged 238 cases on axial images alone and reported sensitivity 100% and specificity 96% for distinguishing "normal plus stable partial tear" from "unstable partial tear plus complete tear" (original p. 1489). These figures do not show that axial images can recognize partial tear: axial appearances of 17 of 20 stable partial tears fell in the same categories as normal ACL; which categories were assigned to "stable" and which to "unstable" was determined stepwise during analysis (original pp. 1489–1490)—grouping rules and sensitivity came from the same dataset.
Van Dyck et al. (2011), in a prospective 3 T study of 172 cases, reported sensitivity 77% and specificity 97% for partial tear, and 83% and 99% for complete tear (original Table 1, p. 703). Of 40 tears, 5 were mistyped between partial and complete: 2 acute injuries with cloudlike high-signal masses at the femoral origin were MRI-diagnosed complete tears but arthroscopically stable partial tears; 1 acute injury MRI-diagnosed as partial tear was complete at arthroscopy 17 days later; 2 chronic injuries diagnosed as partial tear because of fibrous scar adhesion in the notch were complete at arthroscopy (original pp. 703–706). The study excluded cases with typical mucoid degeneration on MRI and a stable intact ACL at arthroscopy (original p. 702)—precisely the category most easily confused with partial tear—so specificity is overstated.
Van Dyck et al.'s (2012) 25%–53% is the proportion of partial tears correctly diagnosed; there were no normal controls, so it cannot be compared with overall accuracy in mixed populations; that study and the 2011 study came from the same hospital and period, and whether cases overlapped is not stated in either paper (original pp. 256–257). Interreader κ was 0.48 and 0.56 (original p. 258).
Dejour et al. (2013) enrolled 300 patients all with instability symptoms and laxity on examination; arthroscopy found 177 complete tears and 123 partial tears (66 PL-preserving, 21 AM-preserving, 36 stump healed to PCL) (original p. 494). MRI was classified by three appearances (original Table 5; percentages calculated from counts):
| Arthroscopic type | Fiber absence or severe distortion | Continuous fibers visible | Fibers adherent to PCL |
|---|---|---|---|
| Complete tear (177) | 170 (96%) | 2 (1%) | 5 (3%) |
| AM-preserving (21) | 11 (52%) | 9 (43%) | 1 (5%) |
| PL-preserving (66) | 56 (85%) | 2 (3%) | 8 (12%) |
| PCL healing (36) | 25 (69%) | 4 (11%) | 7 (19%) |
Of 17 cases with continuous fibers visible on MRI, 15 were partial tears—when this appearance is present it suggests partial tear—yet only 15 of 123 partial tears (12%) showed it (calculated from the published table). The Discussion writes that the difference between complete (96%) and partial (73%) tears was "not significant" (original p. 497), which does not match the table counts: fiber absence or severe distortion in partial tears was 92/123 (75%), and the difference from 170/177 has chi-square P < 0.001 (calculated from the published table); the Results also state that this appearance was significantly associated with complete tear—the Discussion sentence cannot be cited. MRI was read by the surgeons who examined and operated, mostly under France's national ordinary knee protocol (original pp. 493, 498); most of these patients had chronic injury, and MRI appearances differ from acute partial tear.
Chang et al. (2013) found among 156 primary reconstructions that one bundle was intact in 11 (7%) and that another 55 (35%) had a continuous but attenuated bundle without normal tension (original Table 1). Seventy-seven had MRI at the authors' institution under a uniform protocol (1.5 T with oblique coronal); one musculoskeletal radiologist blinded to arthroscopy judged each bundle: AM judgment was correct in 91% and PL in 78%, with PL errors mainly overestimating injury (original Table 2). The authors conclude that early MRI especially tends to overestimate PL injury; but original Table 3's P values compare AM with PL within the same group, with no between-group comparison of early versus late; direct comparison of the two groups gives PL overestimation of 22% (10/45) versus 9% (3/32), P = 0.22 (Fisher exact, calculated from the published table). Significance within one group and nonsignificance within the other do not establish a difference between groups.
Isolated Bundle Injury
Injury with one bundle intact and the other ruptured is uncommon among patients who need reconstruction: 7% of Chang et al.'s 156; among Dejour et al.'s 300, AM- or PL-preserving cases totaled 87 (29%); among Park et al.'s 76 tears, 24 (32%) were single-bundle, including 18 AM ruptures. Inclusion criteria differed among the three studies; the preserved bundle was more often PL. MRI rarely identifies which bundle is ruptured: among Van Dyck et al.'s (2012) 51 partial tears, MRI diagnosed single-bundle tear in 3 (original p. 258); Dejour et al. considered MRI essentially unable to localize to a bundle (original p. 497); of Park et al.'s 24 single-bundle tears, 8 were still judged double-bundle on conventional images and after reading all oblique planes (Section 2). Oblique axial images can display the two bundles separately. When Ng AW et al. (2013) scored bundles separately, detection of AM partial tear rose from 2/7 to 5/7 and of PL partial tear from 3/10 to 6/10 after adding the oblique axial (original Table 2); these bundles came from 15 knees, of which 2 had partial tear of both bundles, only 1 had a normal AM with isolated PL partial tear, and the remaining knees had injury of both bundles (original p. 212, Table 1). Numbers are small, and the design was conventional images first then combined with the new sequence.
Identifying Partial Tears by PCL Morphology
After complete tear, anterior tibial translation increases PCL bowing (Section 3). Two 2024 studies tried to use this change for partial tear; they measured different angles and answer different questions.
Tokgoz et al. (2024) retrospectively studied 239 arthroscopy patients: 74 partial tears (46 AM injury with intact PL, 28 PL injury with intact AM), 74 complete tears, and 91 intact ACLs; the intact group comprised 67 meniscal injuries, 12 patellofemoral disorders, and 12 osteochondral defects (original p. 2183). MRI was 1.5 T, supine extended, slices 3–4 mm. PCL angle (PCLA) is the angle between lines through the centers of the femoral and tibial segments of the PCL; PCL–posterior femoral cortical angle (PCL–PCA) is measured on the most lateral sagittal slice through the tibial PCL attachment, formed by the posterior femoral shaft cortical line and the centerline of the most vertical distal PCL segment (original pp. 2182–2183 and Fig. 1). Mean angles in the partial-tear group lay between intact and complete-tear groups: PCLA 129.1° intact, 116.5° AM injury, 118.4° PL injury, 110.0° complete tear; PCL–PCA 31.3°, 19.7°, 18.8°, and 14.3° (original Table 1). The authors used two ROC analyses to obtain cut-offs separating partial tear from intact ACL (PCLA <123.13°, PCL–PCA <23.77°) and partial from complete tear (PCLA >113.88°, PCL–PCA >16.39°), then synthesized the conclusion that "PCLA 113°–123° and PCL–PCA 16°–24° suggest partial tear" (original Abstract and Table 2).
These diagnostic figures cannot be used. Of 8 sensitivity and specificity values in Table 2, 7 cannot be obtained from the reported denominators—for example 74 partial tears cannot yield 86.8% (64/74 = 86.5%, 65/74 = 87.8%); from the PCLA row's sensitivity and specificity the positive likelihood ratio should be about 8.6, yet the table gives 7.92 (calculated from the published table). Whether the error is in denominator, transcription, or analysis cannot be judged from available material. The interval itself was never tested: the two cut-offs came from separate binary comparisons; using both upper and lower limits together changes positive calls and sensitivity, and the paper reports neither results by interval nor independent validation; the study also has no time-since-injury data or correspondence of angles with examination or laxity. Direction of group means can be used: average PCL bowing in partial tear lies between intact and complete tear, with overlapping distributions (original Table 1). The authors do not disclose research funding; open-access fees were paid by the Scientific and Technological Research Council of Turkey; the authors declare no conflicts of interest (original p. 2186 and supplementary material).
Yang Y et al. (2024) measured two angles of the distal PCL: α between a tangent to the notch roof and a tangent to the posterior margin of the distal PCL, and β between a tangent to the tibial intercondylar eminence and the same PCL tangent (original Fig. 2). From 532 arthroscopy patients they selected 50 partial tears (31 AM, 19 PL) and 50 age- and sex-matched meniscal-tear controls, excluding complete tear and ACL mucoid degeneration; one inclusion criterion for the partial-tear group was that imaging had already diagnosed ACL injury and intraoperative confirmation followed (original pp. 3016–3017 and Fig. 1). The partial-tear group had smaller α (64.0° ± 9.8° versus 79.1° ± 7.7°) and larger β (79.9° ± 5.7° versus 71.0° ± 5.8°); at α 73.6°, AUC 0.88, sensitivity 74%, specificity 84%; at β 73.3°, AUC 0.86, sensitivity 64%, specificity 92% (original Tables 2 and 3). Calculated from 50 per group and the reported sensitivity and specificity, diagnostic odds ratios for α and β should be 14.9 and 20.4, yet the text reports 14.10 and 14.54—a larger discrepancy for β—without stating an adjusted model (original p. 3019, calculated from the published numbers). Study design limits the scope of the conclusion: the partial-tear group itself consisted of cases already diagnosed as ACL injury on imaging, so the study cannot show whether these angles can detect partial tears missed on conventional MRI; without a complete-tear group, they also cannot distinguish partial from complete tear. The study was funded by a Taizhou science and technology plan; the authors declare no conflicts of interest (original p. 3021).
Dos Reis Morimoto et al. (2026) write that PCLA 113°–123° and PCL–PCA 16°–24° distinguish partial tear from intact and complete tear with high sensitivity and specificity and are especially useful in chronic cases or when conventional MRI is unclear (original pp. 1801–1802 and Fig. 5). The sole basis is Tokgoz et al., who never tested that interval. The review describes PCLA as the angle between lines along the anterior and posterior PCL margins, unlike the original study's lines through the centers of the femoral and tibial segments. PCL–PCA is described simply as the angle between the posterior femoral cortex and the PCL "central axis," omitting the original's two conditions: use the most vertical distal PCL segment, and measure on the most lateral sagittal slice through the tibial PCL attachment. Fig. 5B of the review still shows a distal-segment axis, but that wording alone cannot reproduce the original method (original pp. 1801–1802 and Fig. 5; Tokgoz et al. original p. 2183). The review later cites Yang Y et al. to say these angles overlap with intact and complete tear (original p. 1808), yet Yang Y et al. measured neither of these angles and had no complete-tear group.
PCL morphology can serve only as an auxiliary clue to partial tear. Increased PCL bowing suggests possible anterior tibial translation and is consistent with partial tear; an angle falling in some interval cannot confirm partial tear, still less establish whether residual fibers function or whether surgery is needed. Drawing methods for PCL angle differ among studies (Section 3, "Summary of Indirect Signs"); when citing a threshold, state drawing method, slice, and position together.
Residual Fibers and Ligament Function
MRI shows fiber continuity, caliber, and course; it does not directly show fiber tension. Dejour et al.'s arthroscopic examination used probe tension to judge whether residual fibers resist further elongation: residual fibers were functional in 67% of PL-preserving tears versus 17% of AM-preserving and PCL-healing types combined (original p. 494). Side-to-side difference in anterior tibial translation on stress radiographs was 4.4 ± 2.4 mm for functional partial tear, 7.0 ± 2.5 mm for nonfunctional, and 9.1 ± 3.4 mm for complete tear (original Table 4). In the same table, side-to-side differences for the three partial-tear types were 5.2, 5.1, and 7.0 mm (n = 21, 66, and 36)—about 5.7 mm weighted by numbers—yet the "all partial tears" row (matching the Abstract) gives 5.2 mm, unexplained (calculated from the published table); these means show direction of comparison and should not be treated as precise quantitative standards. Original Table 5 compares only the three MRI appearances with arthroscopic type and does not group by whether residual fibers were functional; MRI's ability to recognize a functional remnant is not reported. Chang et al.'s 55 "continuous but attenuated" bundles were judged nonpreservable at arthroscopy (original p. 3287). Oblique coronal images can show stump attachment: of Kosaka et al.'s (2014) 27 tears, 18 had a stump attached to the femur or PCL, and stump recognition rose after adding oblique coronal, but that study's reading design was flawed (Section 2). This chapter's material contains no study validating the accuracy of MRI estimates of tear percentage (e.g., "about half torn").
Loading the knee during MRI is another attempt to measure laxity directly. Espregueira-Mendes et al. (2012) used the Porto Knee Testing Device (PKTD) at 30° flexion with a 46.7 kPa air bladder pressing the posterior proximal calf to translate the tibia anteriorly; the foot started in neutral and the tibia could rotate freely under load. On 1.5 T three-dimensional spoiled gradient-echo images they measured anterior translation of the medial and lateral tibial plateaus before and after loading, taking lateral minus medial translation as an index of rotational laxity without measuring rotation angle directly (original pp. 672–673 and Fig. 1). Of 33 cases, 5 were judged partial tear by MRI-PKTD (3 PL, 2 AM), all confirmed at arthroscopy; these 5 did not enter displacement or correlation analyses, which used 28 complete tears confirmed at arthroscopy more than 6 months after injury (original pp. 673, 676). Agreement in 5 cases shows that partial tear was correctly recognized but cannot yield sensitivity or specificity; the paper also does not compare independent readings of these 5 before and after loading, so it cannot show that loading recognized more partial tears than conventional MRI. Indices such as lateral-minus-medial plateau translation correlated with pivot-shift grade under anesthesia but not significantly with the Lachman test (original Table 4). Displacement figures in the tables cannot be used: in Table 2 mean medial plateau translation in injured knees (10.1 mm) exceeds lateral (6.5 mm), yet the same table's "lateral minus medial" minimum is 1 mm—implying lateral greater than medial in every case; Table 3 side-to-side differences are medial 4.2 mm and lateral 8.4 mm, which from Table 2 means should be 8.4 mm and 4.8 mm (original p. 675, calculated from the published table). The paper does not explain these contradictions. The study shows that measuring tibial-plateau translation under load during MRI is feasible; displacement values cannot be used because of internal table contradictions, and accuracy of rotational-laxity measurement was not validated. The device was developed at the authors' sports medicine center (original Fig. 1 legend); the paper does not separately state funding or conflicts of interest. Dos Reis Morimoto et al. (2026) consider the PKTD potentially helpful for evaluating partial tear while noting that it has been studied mainly in complete tears (original p. 1802); the review is inconsistent on force direction, writing in the text that a "posterior force" is applied to the proximal calf without clarifying whether that is force direction or application site, and in Fig. 6 legend describing an anterior force on the proximal tibia to evaluate posterior tibial translation (original pp. 1802–1803). The original method presses behind the proximal calf and measures anterior tibial translation.
Clinical Meaning of a Partial-Tear Diagnosis
An MRI report of "partial tear" is a judgment based on signal, fiber morphology, and course; corresponding arthroscopic findings vary widely—stable partial tear, a remnant that has already failed, or an intact ligament with altered signal. An MRI report of "complete tear" may also be a PL-preserving partial tear that still has some function. Oblique planes along the ACL make stump and bundles clearer, and detection of partial tear rose in Ng AW et al. (2013) and in corrected Li et al. (2023); whether MRI can judge partial tear well enough to decide treatment has not been validated. Whether residual fibers function must be judged by physical examination and laxity measurement. In Dejour et al., pivot shift 0 or 1+ with stress side-to-side difference <4 mm identified functional partial tear with sensitivity 0.76 and specificity 0.90; positive pivot shift with side-to-side difference >9 mm identified complete tear with sensitivity 0.88 and specificity 0.96 (original p. 495)—thresholds derived from the same dataset and not externally validated. When MRI and examination disagree, the author places more weight on a standardized pivot-shift test and bilateral laxity measured with the same instrument. Conservative versus surgical choices for partial tear are covered in the chapter Partial ACL Tear: Decision between Conservative Treatment and Reconstruction.
5. Acute and Chronic Injury
Studies define "acute" and "chronic" differently; check the grouping before comparing figures: Brandser et al. (1996) included only acute tears imaged within 6 weeks of injury; Vahey et al. (1991, 1993) defined acute as within 6 weeks and chronic as beyond 6 months, excluding cases between; Tung et al. (1993) used 9 weeks when analyzing bone contusion; Van Dyck et al. (2012), Chang et al. (2013), and Xu B et al. (2018) used 6 weeks; Yoon et al. (2013) used four groups—within 6 weeks, 6 weeks to 3 months, 3 months to 1 year, and beyond 1 year; Xu Z et al. (2021) included only patients more than 6 weeks after injury.
Acute Findings
Vahey et al. (1991) is an early study dedicated to comparing MRI appearances of acute and chronic tears. From 658 knee MRIs the authors selected 52 arthroscopically confirmed complete tears (22 acute, mean 17 days from injury to MRI; 30 chronic, mean 5.5 years) and 29 intact ACLs as controls; partial tears were excluded (original p. 251). The hallmark of acute tear was soft-tissue edema in the ACL region: on that study's 1.5 T images with TR 1600–2000 ms (fat suppression is not mentioned; fat retains high signal in the figures), edema was low to intermediate on proton-density images (TE 20 ms) and mildly increased on T2-weighted images (TE 60–80 ms), approximately equal to fat—distinct from free joint fluid, which is markedly high on T2-weighted images (original pp. 251–252 and Fig. 1). That comparison uses fat signal on that sequence as reference and does not apply to fat-suppressed images. Of 22 acute tears, 9 showed a well-marginated edematous mass—this cloudlike mass was seen only in acute tears; 8 showed smaller, ill-defined edematous foci with ligament discontinuity; 5 showed only ruptured ligament fragments without recognizable edema and were misjudged as chronic—these 5 were imaged 1, 11, 24, 28, and 28 days after injury (original pp. 252–253 and table). A tear one day after injury can lack edema, and a tear more than 4 weeks after injury can still show a large edematous mass (original p. 253). All 22 acute tears were diagnosed as torn; none was misjudged as normal.
The main difficulty in acute interpretation is hemorrhage and edema obscuring fiber morphology: of Van Dyck et al.'s (2011) 5 mistyped between partial and complete, 3 acute injuries had fiber morphology masked by early hemorrhage (original p. 704); Chang et al. (2013) overestimated PL injury in 10 of 45 imaged within 6 weeks (original Table 3). In studies of acute patients, flexed positions improved femoral-end display (Muhle et al., 2013); oblique coronal imaging at 30° flexion showed the full ACL length on more slices, with higher sensitivity and specificity than conventional extension, but plane, slice thickness, and number of signal averages also changed, so the gain cannot be attributed to flexion alone (Chen et al., 2024). When acute patients can tolerate it, flexed scanning helps recognize the femoral end against hemorrhage and edema; pain and effusion limit attainable flexion (Section 2).
Chronic Tears and "False Continuity" from Scar
Among Vahey et al.'s (1991) 30 chronic tears, the most common appearance was discontinuous fragments without edema (11), often with abnormal course and scar adhesion to the PCL; complete nonvisualization of the ACL in 4; and in 9 (30%) a continuous low-signal band connecting the expected ACL origin and insertion—of which 5 with focal angulation were correctly diagnosed as chronic tear and 4 with a straighter course were misjudged as intact ligaments (original pp. 252–253 and table). The authors note that stumps most often adhere to the lateral side of the PCL, not far from the ACL's femoral attachment (original pp. 252–253). They report sensitivity 87% and specificity 93% for distinguishing chronic tear from intact ACL, while stating that this is a "selected population": controls were selected, partial tears and cases between 6 weeks and 6 months after injury were excluded, and in 9 of 30 chronic tears arthroscopy had been performed only before MRI (original pp. 251–253). These figures cannot represent everyday diagnostic accuracy; their value is in recording the specific appearance of chronic tears mistaken for intact ligaments.
Chronic complete tear appearing as a continuous ligament is recorded in several studies. The one miss in Van Dyck et al. (2011) showed on sagittal images a relatively straight continuous low-signal band from expected origin to insertion, irregular and attenuated in its proximal half, with a thin origin on axial images—a chronic complete tear scar-adherent to the PCL at arthroscopy; another 2 chronic complete tears were diagnosed as partial tear because of fibrous scar adhesion in the notch (original p. 706 and Fig. 4). Among Dejour et al.'s (2013) 300 with ACL insufficiency, 36 (12%) had stump healed to the PCL, of which 4 showed continuous fibers on MRI (original Table 5). In Van Dyck et al. (2013), one complete tear was scored "definitely intact" by both readers at both 1.5 T and 3 T (original Supplementary Table E-2). Ng et al. (2011) note that reparative fibrosis between the stump and the notch, PCL, or synovium enveloping the PCL can keep the ACL on a nearly normal course and make it appear intact; scanning at about 20° of flexion helps show stump attachment to the PCL (original pp. 79–80).
In the author's view, when the ACL appears continuous on MRI yet history suggests chronic injury or examination shows laxity, the bandlike structure is more likely to represent false continuity from scarring after a chronic tear if any of the following are also present (Fig. 3):
- The proximal end of the band does not attach to the medial face of the lateral femoral condyle (lateral wall of the notch) but terminates on the PCL or notch roof; the lateral wall is empty on coronal or axial images (Tung et al., 1993; Dejour et al., 2013; Vahey et al., 1991);
- The band has focal angulation, or its proximal segment is irregular and attenuated (Vahey et al., 1991, Fig. 3; Van Dyck et al., 2011, Fig. 4);
- The course is flatter than the Blumensaat line, or overly vertical (Van Dyck et al., 2011 complete-tear criteria);
- There is accompanying anterior tibial translation ≥5 mm, uncovering of the posterior horn of the lateral meniscus, or PCL buckling (Section 3).
Absence of all of the above does not exclude chronic tear: Vahey et al.'s 4 misjudged cases had a relatively straight course, and Van Dyck et al.'s miss was also a relatively straight low-signal band. Of Vahey et al.'s 4 misjudgments, 3 showed local thickening, mild undulation, or blurred contours, but so did 5 of 29 intact ACLs—these cannot serve as signs of chronic tear (original p. 253). When the ACL appears continuous and chronic tear is suspected, judgment depends most on three sources: whether history includes a clear sprain and giving-way, the degree of laxity on examination, and the proximal attachment of the stump on oblique coronal or flexed scanning (Section 2).
Studies Inferring Time Since Injury
Xu B et al. (2018) retrospectively compared signs in 377 arthroscopically confirmed tears—160 acute (within 6 weeks) and 217 chronic (beyond 6 weeks): diffuse high signal on T2-weighted images 55.0% acute versus 3.2% chronic; femoral–tibial "kissing" contusions 54.4% versus 0; collateral ligament injury 20.6% versus 2.3% (original Table 2). The study's data are inconsistent in several places: Methods define acute as within 6 weeks and in the same sentence give a range of 1–47 days; "kissing" contusions are 57.4% in Abstract and Results but 54.4% (87/160) in Table 2; the chronic group has 7 "notch signs" with both subitems 0; acute cartilage injury is 23, yet the three subitems yield 23 under neither mutually exclusive nor overlapping counting; several P values cannot be recalculated from the same table's counts—for example PCL abnormality 61/160 versus 129/217 has chi-square P < 0.001, yet the table gives 0.011 (original pp. 1–3 and Table 2, calculated from the published table). Differences for diffuse high signal, "kissing" contusions, and collateral ligament injury are so large that the above data problems do not change their direction; other differences and the table's P values are not used as judgment criteria in this chapter. The study has no intact-ACL controls and cannot be used to calculate diagnostic accuracy.
Yoon et al. (2013) screened 151 of 504 arthroscopically confirmed complete tears with a single traumatic event confirmed by repeated questioning and without concomitant PCL or collateral ligament injury, and built three logistic regression equations estimating whether injury was beyond 6 weeks, 3 months, and 1 year, reporting classification accuracies of 82.1%, 89.4%, and 89.4% (original pp. 20, 22–23). These accuracies were calculated on the same cases used to build the models and were not independently validated; group sizes differed greatly, and assigning all cases to the larger side already yields accuracies of 53.0%, 59.6%, and 74.8% (calculated from the published numbers). The intended use is medical disputes and insurance claims with contested injury dates, yet inclusion itself required a clear injury date; knee position during scanning was not standardized, and PCL angle varies with it (original p. 24). These data can show how several signs change with time in a population: higher ACL morphologic grade is more often seen in chronic tears; joint effusion volume, PCL angle, and bone-contusion signal contrast all decline with time (original p. 22). They cannot be used to determine the injury date of an individual case.
Data on how anterior tibial translation and PCL morphology change with course are insufficient. Vahey et al. (1993) found anterior tibial translation 5.8 mm in the chronic group versus 4.1 mm acute, a nonsignificant difference; sharp PCL angulation occurred in 8/33 chronic and 2/27 acute tears (original p. 818)—small numbers, nonsignificant (Fisher exact P = 0.16, calculated from the published numbers). Data on fat-pad edema resolving with time are in Section 3.
Judging Time Since Injury
Population data consistently show that edema or diffuse signal increase in the ACL region, typical bone contusion, pericruciate fat pad edema, and joint effusion are mostly seen within weeks to about three months after injury and then gradually resolve; chronic tears more often show fragments without edema and stump adhesion, and the PCL angle also decreases with time since injury. These findings help judge whether an injury is roughly recent or chronic, but individual cases often have exceptions: Vahey et al. (1991) showed that a tear one day after injury can lack edema, a tear more than 4 weeks after injury can have a large edematous mass, and scar tissue from a chronic tear may have torn again recently. This chapter's material contains no externally validated method that can determine the injury date of an individual case. The misjudgment most needing prevention in chronic tear is reading a continuous low-signal band formed by scar as an intact ligament; the key to judgment is where the proximal end of that low-signal band attaches.
6. Situations Prone to Misinterpretation
Mucoid Degeneration and ACL Cysts
Mucoid degeneration is deposition of mucoid matrix between ACL fibers; the ligament thickens and signal increases while fibers remain continuous. The typical appearance is low-signal fibers separated by high-signal material arranged along the ligament's long axis—the celery-stalk sign; it may be accompanied by ACL ganglion cysts and intraosseous cysts at the femoral and tibial attachments (Ng et al., 2011; Celikyay et al., 2020). Mucoid degeneration generally does not cause knee instability (Van Dyck et al., 2011, p. 707; Celikyay et al., 2020). Ng et al. (2011) note that ACL ganglion cysts and mucoid degeneration on MRI are usually not discoverable at arthroscopy (original p. 82); normal arthroscopic findings do not exclude mucoid degeneration.
Celikyay et al. (2020) compared 42 MRI-diagnosed mucoid degeneration cases (43 knees, mean age 54.6 years; those unstable on examination already excluded) with 37 arthroscopically confirmed complete tears (mean age 29.4 years) (original p. 2). Findings were as follows (original Table 1; percentages calculated from counts):
| Finding | Complete tear (37) | Mucoid degeneration (43 knees) |
|---|---|---|
| Fiber discontinuity | 36 (97%) | 0 |
| Increased signal on fat-suppressed proton-density–weighted images | 37 (100%) | 43 (100%) |
| Lateral bone contusion | 24 (65%) | 1 (2%) |
| Anterior tibial translation >5 mm | 26 (70%) | 6 (14%) |
| Uncovering of the posterior horn of the lateral meniscus | 17 (46%) | 3 (7%) |
| Celery-stalk appearance | 0 | 28 (65%) |
| Thickening (≥7 mm) | 7 (19%) | 43 (100%) |
| ACL ganglion cyst | 5 (14%) | 30 (70%) |
| Intraosseous cysts at attachments | 3 (8%) | 27 (63%) |
This table's comparison has two biases. The mucoid-degeneration group was diagnosed by the investigators from MRI appearance without arthroscopic or histologic confirmation; thickening and celery-stalk appearance are themselves diagnostic criteria, so the comparison is partly circular; age and sex composition of the two groups differ greatly, and partial tears were excluded (original p. 2). Angle thresholds in the paper (ACL angle ≤36°, Blumensaat angle >11°, PCL angle ≤96°) therefore apply only to distinguishing complete tear from mucoid degeneration and cannot be used for the harder distinction between partial tear and mucoid degeneration. The authors declare no competing interests (original p. 6).
Distinguishing partial tear from mucoid degeneration is harder: of Van Dyck et al.'s (2012) 51 arthroscopically confirmed partial tears, 12%–27% were diagnosed as mucoid degeneration by readers (original Table 1 and Fig. 4). An ACL with increased signal and continuous fibers, marked thickening, low-signal fibers separated into bundles with normal course, accompanying ganglion or attachment intraosseous cysts, no clear trauma or no acute effusion after trauma, stable examination, and older age support mucoid degeneration; a clear sprain history with acute effusion, lateral-compartment bone contusion, anterior tibial translation or uncovering of the posterior horn of the lateral meniscus, partial fiber interruption, or flattened course favor tear. The two can coexist, and longitudinal laminar partial tear can also resemble mucoid degeneration (Van Dyck et al., 2012, p. 259). When imaging cannot distinguish, judge by presence or absence of anterior and rotational laxity on examination.
Partial Volume, Plane Selection, and Artifact
The ACL runs obliquely and is surrounded by the lateral femoral condyle, fat in the notch, and effusion, so it is readily affected by partial-volume averaging. When the sagittal plane is not prescribed along the ligament, a single slice includes only part of it; partial volume with the medial face of the lateral femoral condyle, the notch roof, or effusion can make a normal ACL appear abnormal or blurred; popliteal arterial pulsation artifact can also interfere (Tung et al., 1993, pp. 661, 665; Brandser et al., 1996, p. 124; Niitsu et al., 1998, pp. 114–115). Near the tibial insertion fiber bundles fan out with intervening fat and can show increased signal on axial images (Roychowdhury et al., 1997, p. 1491). Intraligamentous signal on gradient-echo images can come from magic-angle effect; switching to long-TE T2-weighted images reduces that artifact (Umans et al., 1995, p. 897). A normal ACL itself can show mild undulation, local thickening, or blurred contours: 5 of Vahey et al.'s (1991) 29 arthroscopically confirmed intact ACLs had such findings (original p. 252).
To judge whether an abnormality is real, observe whether it appears continuously on adjacent slices, whether it is confirmed on coronal and axial images, and whether it persists after switching to long-TE T2-weighted images. Abnormality seen on only a single slice of a single sequence is more likely technical. Misjudgment from plane selection is not rare: in Kwon et al.'s data, with orthogonal planes alone about one sixth of intact ACLs were misdiagnosed as torn (Section 2).
Continuity on Imaging with Insufficient Function
Piedade et al. (2025) reported 15 patients who after sprain could not return to prior sport levels for a long time and had not previously been diagnosed with ACL injury: delay from injury to diagnosis was 3–24 months; anterior drawer and pivot-shift tests were negative, and the Lachman was only slightly looser than the contralateral side with a firm endpoint; MRI reports were "uncertain" in 5 and otherwise described only meniscal or medial collateral ligament changes; at arthroscopy all 15 ACLs were continuous but lax—termed ACL plastic deformation by the authors (original pp. 4, 8 and Table 5). All 15 had knee discomfort with cutting; none complained of instability (original Tables 3 and 7).
This series shows that ACL laxity and failure at arthroscopy can coexist with no tear identified on MRI and only minimal findings on examination. It cannot give the incidence: the authors do not state the collection period or the total number of contemporaneous patients. MRI tables list only meniscal and medial collateral findings and do not describe the ACL itself (original Table 5), so one cannot tell whether these ACLs were entirely normal on imaging or had mild signal or course changes; the judgment of "plastic deformation" rests only on arthroscopic laxity, without histology or objective laxity measurement. Corresponding author Maffulli is editor-in-chief of the journal that published the paper; this was disclosed in the conflict-of-interest statement (original p. 10).
When the ACL is continuous on MRI yet the patient has recurrent giving-way and laxity on examination, the author considers in turn: scar connection of a chronic stump to the PCL or notch producing "false continuity"; elongated residual fibers that have lost tension after partial tear; elongation without fiber interruption (plastic deformation as termed by Piedade et al.); and technical underdiagnosis. The first two often leave clues on MRI—bandlike structure not arising from the lateral wall of the notch, focal angulation, proximal attenuation, with anterior tibial translation, uncovering of the posterior horn of the lateral meniscus, or PCL buckling (Sections 3 and 5); the latter two can show no ACL abnormality at all. Distinguishing these situations depends most on a standardized Lachman and pivot-shift test, bilateral laxity measured with the same instrument, and when needed examination under anesthesia and arthroscopic probing. Instability can also come from structures other than the ACL.
Children
Duart et al. (2023) review pediatric anatomic features that affect interpretation: distance from the femoral attachment to the physis is about 3 mm and remains constant during growth; the younger the child, the more horizontal the ACL course at the tibial insertion, stabilizing around age 18; the notch widens markedly before age 11 (original p. 5).
Primary data on MRI diagnosis of pediatric ACL tear come from Lee et al. (1999). That study retrospectively reviewed 43 patients aged 5–16 years with open or partially open physes who underwent both MRI and arthroscopy; arthroscopy found 19 ACL tears (17 complete, 2 partial) and 24 intact (including 2 tibial spine avulsion fractures); all tears were in adolescents aged 12–16, and younger children appeared only in the control group. MRI was 1.5 T, knee extended and externally rotated about 15°, slices 4 mm; two pediatric radiologists read by consensus (original pp. 697–700). Combining all signs, tear was correctly diagnosed in 18/19 (95%) and intact in 21/24 (88%). Among direct signs, abnormal Blumensaat angle was most sensitive: 27.9° ± 14.6° in tears versus −4.1° ± 9.2° intact; at a 10° threshold the paper reports sensitivity 94% and specificity 96%. Of 18 measurable tears, 16 exceeded the threshold in the table, which would give sensitivity 89%; the paper does not explain the difference (original pp. 698, 700). Fiber discontinuity was seen in 4/19 (21%); that study counted only a focal cleft or division into two or more segments as discontinuity (original p. 699). Among indirect signs, lateral bone contusion occurred in 13/19, but also in 3 of 24 intact ACLs; anterior tibial translation >5 mm occurred in 12/19 tears; 2 intact cases measured 7 mm and 10 mm (original pp. 699–701 and table). The only miss was 1 partial tear that appeared as a continuous fiber band with normal course on MRI (original p. 703).
Lee et al. used mean angles from their own sample as thresholds. Per the paper, mean Blumensaat angle in measurable cases (18 tears, 23 intact) was 9.5°, rounded by the authors to 10°; mean PCL angle was 114.8°, rounded to 115° (original pp. 700–701). Page 698's table still lists >9.5° and <114.8°, while the table note and text use the rounded 10° and 115°. Thresholds depend on this sample's measurements and the two groups' proportions and were not tested in other cases. Duart et al.'s review cites precisely this study, retaining >9.5° for Blumensaat angle and <115° for PCL angle (original pp. 7–9), without new validation. Counts in the PCL-angle row also fail to match the reported sensitivity and specificity; the two columns may be swapped (calculated from the published table).
Tibial spine avulsion needs separate consideration. In Lee et al.'s 2 children with tibial spine fracture, the ACL was intact at arthroscopy yet showed signal or contour abnormality on MRI, and 1 had four indirect signs at once (original pp. 701, 703); the authors attribute such false positives to partial-volume effects of surrounding hematoma. Bony avulsion is readily shown on radiographs and CT (Ng et al., 2011, Fig. 1). Duart et al. note that cartilaginous avulsion must still be considered when radiographs are normal and that the avulsed fragment can appear "double PCL"–like on MRI, yet the cited reference for that sentence is a study of changes in pediatric ACL reconstruction volume during the COVID-19 pandemic (original p. 7, reference 41)—mismatched to the content.
Bone contusion has lower specificity in children: data cited in Lee et al.'s Discussion show ACL tear in 13 of 18 adolescents with typical bone contusion; the authors attribute this to greater ligamentous laxity in the young (original pp. 702–703). Course-angle and indirect-sign thresholds from adult studies should not be applied directly to children, especially younger children with open physes.
7. Content of the MRI Report
An ACL report useful to clinicians should include the following:
- Examination conditions: field strength; whether the sagittal plane was prescribed along the ACL; whether oblique coronal, oblique axial, flexed, or three-dimensional reconstruction was added; motion artifact, nonuniform fat suppression, or similar problems should be stated. Poor visualization of the femoral end is a limitation of the images, not equivalent to ligament abnormality.
- Whether the ACL is abnormal and on what basis: state the direct signs seen, including in which segment fibers are interrupted and on which planes this is shown, whether the femoral end has normally attaching fibers on coronal or axial images, and course, morphology, and signal—not only the conclusion.
- Injury grade: complete tear, partial tear (or suspected partial tear when signs are insufficient), or indeterminate. For partial tear, state supporting signs such as abnormal signal, partial fiber interruption, fiber distortion or attenuation, abnormal course, and in which segment continuous fibers can be confirmed; do not write "torn about X%"—such estimates are unvalidated (Section 4).
- Tear location and residual fibers: state tear location when recognizable; when repair is under consideration, note that MRI judgment of proximal tears may be biased toward midsubstance (Section 3); whether the stump attaches to the lateral wall of the notch or is adherent to the PCL or notch roof.
- Key indirect signs: site of bone contusion; numeric value and measurement slice for anterior tibial translation; uncovering of the posterior horn of the lateral meniscus; PCL morphology. State the method for measured values and the drawing method for PCL angle, to allow comparison with follow-up or the literature.
- Consistency with time since injury: when the injury date is known, state whether findings are consistent with it (Section 5).
- Uncertainties and what would most change the judgment: for example "femoral end poorly visualized; recommend adding oblique coronal, oblique axial, or flexed imaging," or "increased signal with continuous fibers; mucoid degeneration and partial tear cannot be distinguished—correlate with examination laxity."
Van Dyck et al. (2012) likewise recommend that radiologists emphasize description for partial tears and alert clinicians to the possibility of partial tear (original pp. 260–261). The ESSR 2024 recommendations advocate reporting ligament injury as full-thickness or partial tear while recognizing MRI's limitations for partial tear (Parkar and Adriaensen, 2024, p. 6597). Findings in menisci, cartilage, other ligaments, and bone should still be described as in any complete knee MRI report.
Data-Scope Note
This chapter rests on 56 sources: 53 journal articles (including 1 formal corrigendum to Gunaydin et al., 2019) and 3 institutional documents (the ESSR 2016 knee reference protocol, the ACR 2025 MRI accreditation parameters page, and the 2025 revision of the ACR–SPR–SSR Practice Parameter for MRI of the Knee). Material came from a directed search in September 2026: PubMed searches for ACL, MRI, and diagnosis-related studies, with additional searches on partial tear, chronic tear, mucoid degeneration, indirect signs, examination position, oblique and thin-slice scanning, flexed scanning, field strength, and three-dimensional sequences, and tracing of originals from reviews and primary-study reference lists; in October 2026 PubMed was updated by entry date through October 9, and primary studies related to native ACL diagnosis cited in Dos Reis Morimoto et al. (2026) were traced. This is not a systematic review and did not screen every search result item by item; studies not retrieved are outside the discussion, and phrases such as "not in this chapter's material" and "available material" refer to these 56 sources. For the two meta-analyses (Phelan et al., 2016; Li et al., 2017) and Shakoor et al. (2019), this chapter uses only their pooled figures and did not consult each included primary study. ACR parameters secondarily cited by Al Mohammad and Gharaibeh (2024) are taken from the original ACR documents.
Figures follow original tables; figures marked "calculated from the published table" or "calculated from the published numbers" were computed by the author and are not given in the originals. Li et al. (2023) and Van Dyck et al. (2013) also used their online supplementary materials; Kosaka et al. (2014) used the authors' accepted manuscript, cited here by table number and Methods; the ESSR 2016 reference protocol is cited by PDF page, the ACR Practice Parameter by section number. Li et al. (2023) is dated 2023 per the journal footer; PubMed's publication date is January 2024. Volume, issue, and pages for Draghi et al. (2017) follow PubMed; page numbers cited in the text are those of the online-first full text used for this chapter.
References
- [1]
Al Mohammad B, Gharaibeh MA. Magnetic Resonance Imaging of Anterior Cruciate Ligament Injury. Orthop Res Rev. 2024;16:233-242. PMID 39385973; DOI 10.2147/ORR.S450336.
- [2]
American College of Radiology. MRI Exam-Specific Parameters: MSK Module (Revised 3-5-2025). ACR accreditation support webpage, revised March 5, 2025. Web page. Full text.
- [3]
American College of Radiology, Society of Pediatric Radiology, Society of Skeletal Radiology. ACR–SPR–SSR Practice Parameter for the Performance and Interpretation of Magnetic Resonance Imaging (MRI) of the Knee. Revised 2025 (Resolution 7). Web page. Full text.
- [4]
Başbuğ V, Türkmen F, Yaka H, Özer M, Kaçira BK. Time-dependent diagnostic value of pericruciate fat pad edema in arthroscopically confirmed anterior cruciate ligament rupture: A comparative MRI study. J Orthop Sci. 2026 (online ahead of print; volume/issue/pages pending). PMID 42637628; DOI 10.1016/j.jos.2026.08.002.
- [5]
Bhinder KK, Kanwal A, Saeed Wahla M, Mehboob A, Ahmed MA, Ziad A, et al. Assessment of the Reliability and Diagnostic Accuracy of Indirect MRI Signs for ACL Tears: Comparison with Arthroscopic Findings as the Gold Standard. Niger Med J. 2026;67(3):1230-1240. PMID 42626092; DOI 10.71480/nmj.v67i3.882.
- [6]
Brandser EA, Riley MA, Berbaum KS, el-Khoury GY, Bennett DL. MR imaging of anterior cruciate ligament injury: independent value of primary and secondary signs. AJR Am J Roentgenol. 1996;167(1):121-6. PMID 8659355; DOI 10.2214/ajr.167.1.8659355.
- [7]
Celikyay F, Yuksekkaya R, Bilgic E. A Retrospective Comparison of ACL Tear and Mucoid Degeneration MRI Findings and an Emphasis on Evaluating of ACL, Blumensaat, and PCL Angles. J Belg Soc Radiol. 2020;104(1):36. PMID 32676546; DOI 10.5334/jbsr.1654.
- [8]
Chagas-Neto FA, Nogueira-Barbosa MH, Lorenzato MM, Salim R, Kfuri-Junior M, Crema MD. Diagnostic performance of 3D TSE MRI versus 2D TSE MRI of the knee at 1.5 T, with prompt arthroscopic correlation, in the detection of meniscal and cruciate ligament tears. Radiol Bras. 2016;49(2):69-74. PMID 27141127; DOI 10.1590/0100-3984.2015.0042.
- [9]
Chang MJ, Chang CB, Choi JY, Won HH, Kim TK. How useful is MRI in diagnosing isolated bundle ACL injuries? Clin Orthop Relat Res. 2013;471(10):3283-90. PMID 23661302; DOI 10.1007/s11999-013-3055-y.
- [10]
Chen C, Liu X, Wu P, Liang Q, Peng S, Hu P, et al. High-resolution oblique coronal MRI at optimal flexed-knee angle: a novel imaging method for enhanced anterior cruciate ligament tear diagnosis. J Orthop Surg Res. 2024;19(1):456. PMID 39090629; DOI 10.1186/s13018-024-04956-w.
- [11]
Dejour D, Ntagiopoulos PG, Saggin PR, Panisset JC. The diagnostic value of clinical tests, magnetic resonance imaging, and instrumented laxity in the differentiation of complete versus partial anterior cruciate ligament tears. Arthroscopy. 2013;29(3):491-9. PMID 23343713; DOI 10.1016/j.arthro.2012.10.013.
- [12]
Dos Reis Morimoto L, Filho AGO, Bordalo M, Bitar AC, D'Elia CO, Guimarães JB. Diagnosis and imaging assessment of partial anterior and posterior cruciate ligament tears. Skeletal Radiol. 2026;55(8):1797-1812. PMID 41555030; DOI 10.1007/s00256-026-05124-3.
- [13]
Draghi F, Torresi M, Urciuoli L, Gitto S. Magnetic Resonance Signal Abnormalities Within the Pericruciate Fat Pad: A Possible Secondary Sign for Acute Anterior Cruciate Ligament Tears. Can Assoc Radiol J. 2017;68(4):438-444. PMID 28888741; DOI 10.1016/j.carj.2017.04.003.
- [14]
Duart J, Rigamonti L, Bigoni M, Kocher MS. Pediatric anterior cruciate ligament tears and associated lesions: Epidemiology, diagnostic process, and imaging. J Child Orthop. 2023;17(1):4-11. PMID 36755555; DOI 10.1177/18632521231153277.
- [15]
Espregueira-Mendes J, Pereira H, Sevivas N, Passos C, Vasconcelos JC, Monteiro A, et al. Assessment of rotatory laxity in anterior cruciate ligament-deficient knees using magnetic resonance imaging with Porto-knee testing device. Knee Surg Sports Traumatol Arthrosc. 2012;20(4):671-8. PMID 22290127; DOI 10.1007/s00167-012-1914-9.
- [16]
European Society of Skeletal Radiology, Sports Subcommittee (Kassarjian A, Fritz LB, Afonso PD, et al.). Guidelines for MR Imaging of Sports Injuries: Knee. 2016. ESSR website PDF. Full text.
- [17]
Ghasem Hanafi M, Momen Gharibvand M, Jaffari Gharibvand R, Sadoni H. Diagnostic Value of Oblique Coronal and Oblique Sagittal Magnetic Resonance Imaging (MRI) in Diagnosis of Anterior Cruciate Ligament (ACL) Tears. J Med Life. 2018;11(4):281-285. PMID 30894883; DOI 10.25122/jml-2018-0015.
- [18]
Gokalp G, Demirag B, Nas OF, Aydemir MF, Yazici Z. Contribution of thin slice (1 mm) oblique coronal proton density-weighted MR images for assessment of anteromedial and posterolateral bundle damage in anterior cruciate ligament injuries. Eur J Radiol. 2012;81(9):2358-65. PMID 21974974; DOI 10.1016/j.ejrad.2011.09.008.
- [19]
Gunaydin B, Sahin GG, Sari A, Kara A, Dincel YM, Cetin MU, et al. A new method for diagnosis of anterior cruciate ligament tear: MRI with maximum flexion of knee in the prone position: A case control study. Int J Surg. 2019;68:142-147. PMID 31276834; DOI 10.1016/j.ijsu.2019.06.017.
- [20]
Gunaydin B, Sahin GG, Sari A, Kara A, Dincel YM, Cetin MU, et al. Corrigendum to "A new method for diagnosis of anterior cruciate ligament tear: MRI with maximum flexion of knee in the prone position: A case control study" [Int. J. Surg. 68 (2019) 142-147]. Int J Surg. 2020;73:123. PMID 31883749; DOI 10.1016/j.ijsu.2019.12.020.
- [21]
Kijowski R, Davis KW, Woods MA, Lindstrom MJ, De Smet AA, Gold GE, et al. Knee joint: comprehensive assessment with 3D isotropic resolution fast spin-echo MR imaging--diagnostic performance compared with that of conventional MR imaging at 3.0 T. Radiology. 2009;252(2):486-95. PMID 19703886; DOI 10.1148/radiol.2523090028.
- [22]
Kosaka M, Nakase J, Toratani T, Ohashi Y, Kitaoka K, Yamada H, et al. Oblique coronal and oblique sagittal MRI for diagnosis of anterior cruciate ligament tears and evaluation of anterior cruciate ligament remnant tissue. Knee. 2014;21(1):54-7. PMID 23707632; DOI 10.1016/j.knee.2013.04.016.
- [23]
Kwon JW, Yoon YC, Kim YN, Ahn JH, Choe BK. Which oblique plane is more helpful in diagnosing an anterior cruciate ligament tear? Clin Radiol. 2009;64(3):291-7. PMID 19185659; DOI 10.1016/j.crad.2008.10.007.
- [24]
Lee K, Siegel MJ, Lau DM, Hildebolt CF, Matava MJ. Anterior cruciate ligament tears: MR imaging-based diagnosis in a pediatric population. Radiology. 1999;213(3):697-704. PMID 10580941; DOI 10.1148/radiology.213.3.r99dc26697.
- [25]
Li K, Du J, Huang LX, Ni L, Liu T, Yang HL. The diagnostic accuracy of magnetic resonance imaging for anterior cruciate ligament injury in comparison to arthroscopy: a meta-analysis. Sci Rep. 2017;7(1):7583. PMID 28790406; DOI 10.1038/s41598-017-08133-4.
- [26]
Li K, Jhonatan FY, Yu Z, Liu J, Huang L, Yang H, et al. A new modified MR dual precision positioning of thin-slice oblique sagittal fat suppression proton density weighted imaging: its diagnostic accuracy in anterior cruciate ligament injury. Sci Rep. 2023;13(1):23109. PMID 38172628; DOI 10.1038/s41598-023-50909-4.
- [27]
Muhle C, Ahn JM, Dieke C. Diagnosis of ACL and meniscal injuries: MR imaging of knee flexion versus extension compared to arthroscopy. Springerplus. 2013;2(1):213. PMID 23762813; DOI 10.1186/2193-1801-2-213.
- [28]
Nenezic D, Kocijancic I. The value of the sagittal-oblique MRI technique for injuries of the anterior cruciate ligament in the knee. Radiol Oncol. 2013;47(1):19-25. PMID 23450118; DOI 10.2478/raon-2013-0006.
- [29]
Ng AW, Griffith JF, Hung EH, Law KY, Yung PS. MRI diagnosis of ACL bundle tears: value of oblique axial imaging. Skeletal Radiol. 2013;42(2):209-17. PMID 22349646; DOI 10.1007/s00256-012-1372-y.
- [30]
Ng WH, Griffith JF, Hung EH, Paunipagar B, Law BK, Yung PS. Imaging of the anterior cruciate ligament. World J Orthop. 2011;2(8):75-84. PMID 22474639; DOI 10.5312/wjo.v2.i8.75.
- [31]
Niitsu M, Ikeda K, Itai Y. Slightly flexed knee position within a standard knee coil: MR delineation of the anterior cruciate ligament. Eur Radiol. 1998;8(1):113-5. PMID 9442141; DOI 10.1007/s003300050349.
- [32]
Nouri N, Bouaziz MC, Riahi H, Mechri M, Kherfani A, Ouertatani M, et al. Traumatic Meniscus and Cruciate Ligament Tears in Young Patients: A Comparison of 3T Versus 1.5T MRI. J Belg Soc Radiol. 2017;101(1):14. PMID 30039006; DOI 10.5334/jbr-btr.1158.
- [33]
Park HJ, Kim SS, Lee SY, Park NH, Ahn JH, Chung EC, et al. Comparison between arthroscopic findings and 1.5-T and 3-T MRI of oblique coronal and sagittal planes of the knee for evaluation of selective bundle injury of the anterior cruciate ligament. AJR Am J Roentgenol. 2014;203(2):W199-206. PMID 25055294; DOI 10.2214/AJR.13.11571.
- [34]
Parkar AP, Adriaensen MEAPM. ESR essentials: MRI of the knee-practice recommendations by ESSR. Eur Radiol. 2024;34(10):6590-6599. PMID 38536461; DOI 10.1007/s00330-024-10706-7.
- [35]
Phelan N, Rowland P, Galvin R, O'Byrne JM. A systematic review and meta-analysis of the diagnostic accuracy of MRI for suspected ACL and meniscal tears of the knee. Knee Surg Sports Traumatol Arthrosc. 2016;24(5):1525-39. PMID 26614425; DOI 10.1007/s00167-015-3861-8.
- [36]
Piedade SR, Ferreira DM, Górios C, Maffulli N. Plastic deformation of anterior cruciate ligament: listen to the patient, do not just rely on imaging. J Orthop Surg Res. 2025;20(1):144. PMID 39915759; DOI 10.1186/s13018-025-05527-3.
- [37]
Prabakar S, Jawaharlal P, Narayanan S. Diagnostic Efficacy of Fat-Suppressed 3D Volume Isotropic Turbo Spin-Echo Acquisition Imaging Versus Conventional 2D Sequences in the Detection of Cruciate and Meniscal Tears Using a 3-Tesla Magnetic Resonance Imaging Scanner: A Comparative Study. Cureus. 2025;17(6):e86841. PMID 40718309; DOI 10.7759/cureus.86841.
- [38]
Qureshi A, Faatima N, Agrawal SS. Magnetic Resonance Imaging-Arthroscopy Correlation in Traumatic Knee Injuries: A Retrospective Diagnostic Accuracy Study. J Orthop Case Rep. 2026;16(10):440-447. PMID 42851563; DOI 10.13107/jocr.2026.v16.i10.8310.
- [39]
Roychowdhury S, Fitzgerald SW, Sonin AH, Peduto AJ, Miller FH, Hoff FL. Using MR imaging to diagnose partial tears of the anterior cruciate ligament: value of axial images. AJR Am J Roentgenol. 1997;168(6):1487-91. PMID 9168712; DOI 10.2214/ajr.168.6.9168712.
- [40]
Shakoor D, Guermazi A, Kijowski R, Fritz J, Roemer FW, Jalali-Farahani S, et al. Cruciate ligament injuries of the knee: A meta-analysis of the diagnostic performance of 3D MRI. J Magn Reson Imaging. 2019;50(5):1545-1560. PMID 30950549; DOI 10.1002/jmri.26713.
- [41]
Silverman R, Knapik DM, Smith MV, Baker JC, Napier K, Matava MJ, et al. Limited Agreement on ACL Tear Location Between Arthroscopy and MRI: A Prospective Evaluation. Orthop J Sports Med. 2025;13(12):23259671251397389. PMID 41426265; DOI 10.1177/23259671251397389.
- [42]
Tokgoz MA, Oklaz EB, Ak O, Guler Oklaz EB, Ataoglu MB, Kanatli U. The potential of posterior cruciate ligament buckling phenomenon as a sign for partial anterior cruciate ligament tears. Arch Orthop Trauma Surg. 2024;144(5):2181-7. PMID 38492061; DOI 10.1007/s00402-024-05270-0.
- [43]
Tung GA, Davis LM, Wiggins ME, Fadale PD. Tears of the anterior cruciate ligament: primary and secondary signs at MR imaging. Radiology. 1993;188(3):661-7. PMID 8351329; DOI 10.1148/radiology.188.3.8351329.
- [44]
Umans H, Wimpfheimer O, Haramati N, Applbaum YH, Adler M, Bosco J. Diagnosis of partial tears of the anterior cruciate ligament of the knee: value of MR imaging. AJR Am J Roentgenol. 1995;165(4):893-7. PMID 7676988; DOI 10.2214/ajr.165.4.7676988.
- [45]
Vahey TN, Broome DR, Kayes KJ, Shelbourne KD. Acute and chronic tears of the anterior cruciate ligament: differential features at MR imaging. Radiology. 1991;181(1):251-3. PMID 1887042; DOI 10.1148/radiology.181.1.1887042.
- [46]
Vahey TN, Hunt JE, Shelbourne KD. Anterior translocation of the tibia at MR imaging: a secondary sign of anterior cruciate ligament tear. Radiology. 1993;187(3):817-9. PMID 8497637; DOI 10.1148/radiology.187.3.8497637.
- [47]
Van Dyck P, Vanhoenacker FM, Gielen JL, Dossche L, Van Gestel J, Wouters K, et al. Three tesla magnetic resonance imaging of the anterior cruciate ligament of the knee: can we differentiate complete from partial tears? Skeletal Radiol. 2011;40(6):701-7. PMID 20931190; DOI 10.1007/s00256-010-1044-8.
- [48]
Van Dyck P, De Smet E, Veryser J, Lambrecht V, Gielen JL, Vanhoenacker FM, et al. Partial tear of the anterior cruciate ligament of the knee: injury patterns on MR imaging. Knee Surg Sports Traumatol Arthrosc. 2012;20(2):256-61. PMID 21773827; DOI 10.1007/s00167-011-1617-7.
- [49]
Van Dyck P, Vanhoenacker FM, Lambrecht V, Wouters K, Gielen JL, Dossche L, et al. Prospective comparison of 1.5 and 3.0-T MRI for evaluating the knee menisci and ACL. J Bone Joint Surg Am. 2013;95(10):916-24. PMID 23677359; DOI 10.2106/JBJS.L.01195.
- [50]
Xu B, Zhang H, Li B, Wang W. Comparison of magnetic resonance imaging for patients with acute and chronic anterior cruciate ligament tears. Medicine (Baltimore). 2018;97(10):e0001. PMID 29517656; DOI 10.1097/MD.0000000000010001.
- [51]
Xu Z, Chen Y, Zhu J, Zhang L, Wu P. Comparison of the Use of Magnetic Resonance Imaging of Partial Anterior Cruciate Ligament Tears Using Maximum Knee Flexion in the Lateral Decubitus Position with Routine Knee Positioning. Med Sci Monit. 2021;27:e932228. PMID 34593750; DOI 10.12659/MSM.932228.
- [52]
Yang T, Li Y, Yang L, Liu Q. Magnetic resonance imaging of cruciate ligament disorders: current updates. EFORT Open Rev. 2025;10(7):475-486. PMID 40591678; DOI 10.1530/EOR-2024-0093.
- [53]
Yang Y, Zheng B, Zhang M, Lin X, Zhang W, Han D, et al. The angle of the lower portion of the posterior cruciate ligament assists in the diagnosis of partial anterior cruciate ligament tears. Knee Surg Sports Traumatol Arthrosc. 2024;32(11):3015-22. PMID 38989785; DOI 10.1002/ksa.12346.
- [54]
Yoon JP, Yoo JH, Chang CB, Kim SJ, Choi JY, Yi JH, et al. Prediction of chronicity of anterior cruciate ligament tear using MRI findings. Clin Orthop Surg. 2013;5(1):19-25. PMID 23467216; DOI 10.4055/cios.2013.5.1.19.
- [55]
Zhang J, Hao D, Duan F, Yu T, Zhang C, Che J. The rotating stretched curved planar reconstruction of 3D-FIESTA MR imaging for evaluating the anterior cruciate ligament of the knee joint. Magn Reson Imaging. 2019;55:46-51. PMID 30223006; DOI 10.1016/j.mri.2018.09.013.
- [56]
Zhao M, Zhou Y, Chang J, Hu J, Liu H, Wang S, et al. The accuracy of MRI in the diagnosis of anterior cruciate ligament injury. Ann Transl Med. 2020;8(24):1657. PMID 33490169; DOI 10.21037/atm-20-7391.