An anterior cruciate ligament (ACL) reconstruction plan requires separate decisions on the following: where the tunnels are placed and by what tensioning principle; whether one bundle or two are reconstructed; whether the load is carried by autograft tendon, allograft tendon, an artificial ligament, or a composite graft; and, beyond the main construct, whether a residual bundle is preserved, a suture tape is added, or a lateral extra-articular procedure is performed. Statements such as "double-bundle reconstruction is closer to anatomy," "artificial ligaments allow faster recovery," "artificial ligaments cause synovitis," and "autograft plus artificial combines the strengths of both" concern, respectively, fiber architecture, the initial mechanics of the material, tissue reactions to the material, and composite configurations; benefit and cost can coexist in the same plan. Comparing two plans requires first specifying the concrete differences and then locating the corresponding research evidence.
The strength of evidence for these choices differs widely. Bundle number and autograft source already have long-term randomized data; allograft tendons have large prospective cohorts; lateral extra-articular augmentation has large randomized trials. Artificial ligaments and autograft–artificial composites rest mainly on single-center series or series from the same team, and some of the figures cannot be reproduced from the original papers' own tables and forest plots.
1. Basic Components of the Surgical Plan
| Component of the plan | Common names | What is meant |
|---|---|---|
| Graft position and tension design | Anatomic reconstruction; isometric / near-isometric | Where the tunnels are drilled; how tension is borne through flexion and extension |
| Structure after reconstruction | Single-bundle; double-bundle | How the fibers are arranged |
| Material that carries load | Autograft tendon; allograft tendon; artificial ligament; composite graft | What carries the load |
| Adjuncts beyond the main construct | Selective-bundle reconstruction; remnant preservation; suture-tape augmentation; artificial-material reinforcement; LET / ALL reconstruction | What is retained; what is added |
A Shandong study [R36] described a procedure that was simultaneously called "anatomic single-bundle," "all-inside," "hamstring autograft," and "LARS internally augmented composite graft." These names can all be true at once: "anatomic single-bundle" already contains both a localization principle and a bundle count; "all-inside" refers to tunnel preparation and fixation; the last two names refer to graft material and the added artificial component.
What clinicians call an "autograft ligament" is in fact tendon: hamstring tendons (semitendinosus and gracilis), bone–patellar tendon–bone with bone blocks at both ends, quadriceps tendon, or peroneus longus tendon. After implantation they undergo a prolonged remodeling process (end of Section 3). The "four-strand" graft obtained by folding the semitendinosus and gracilis once each is still a single graft and constitutes single-bundle reconstruction.
Bundle number and tunnel number also do not correspond one-to-one. Single-bundle reconstruction drills one tunnel in the femur and one in the tibia [R07]. The number of tunnels in double-bundle reconstruction depends on the technique: the anatomic double-bundle described by van Eck et al. uses two femoral and two tibial tunnels, four in all [R07]; the Pittsburgh randomized trial's double-bundle used one femoral and two tibial tunnels, three in all [R13]. Operations that share the name "double-bundle" are not the same.
2. Anatomic Reconstruction and Bundle Number
Functional Bundle Division and Principles of Anatomic Reconstruction
Functionally, the native ACL is divided into an anteromedial (AM) and a posterolateral (PL) bundle: at larger flexion angles the AM bundle is the principal restraint to anterior tibial translation; near extension the PL bundle contributes more clearly to anterior and rotational stability [R08]. This describes the functional distribution of the fibers. ACL fibers change their tension distribution through flexion and extension as a continuous whole; they are not two independent ropes that remain isometric throughout. Understanding them as two ropes readily leads to the inference that "reconstructing two bundles more closely restores the original state." Fiber morphology and the insertions are covered in Section 1.1.
Anatomic reconstruction means deciding tunnel position and graft size from the location, orientation, and dimensions of that patient's own insertion footprint [R07]. Under this principle, bundle number itself depends on individual anatomy. van Eck et al. require an approximately 2 mm bony bridge between the two tunnels of a double-bundle reconstruction; when the footprint is 16 mm long, the two tunnels together can reach 14 mm (AM 8 mm, PL 6 mm, allocated in the proportion of the native two bundles). When the footprint is shorter than 14 mm or the width of the femoral notch entrance is less than 12 mm, double-bundle reconstruction is technically difficult; the original wording is that single-bundle reconstruction "may be indicated," not that single-bundle must be performed. Other situations favoring single-bundle include open physes, severe bone bruise (especially of the lateral femoral condyle), grade 3 or higher arthritic change, and multiligament injury [R07]. That paper is a 2010 technical and conceptual article, not a comparative efficacy trial; the millimeter figures are that team's operating norms and do not constitute universal cutoffs. Anatomic localization of the femoral end is covered in Section 8.2.1.
Clinical Outcomes of Single-Bundle versus Double-Bundle Reconstruction
The AAOS 2022 guideline holds that either single-bundle or double-bundle reconstruction may be considered, on the grounds that measured outcomes are similar, with high-quality evidence and a strong recommendation [R01]. Evidence published after 2022 has not changed this judgment, but the reporting of two secondary studies affects how they are cited.
The meta-analysis by Xu et al. [R08] included 13 randomized trial reports. The Abstract states that the complication rate was significantly higher in the single-bundle group and concludes by recommending that surgeons prefer double-bundle. In the body, when all 4 studies were pooled for complications there was no significant difference (RR 0.86, 95% CI 0.51–1.45, P=.57), with substantial heterogeneity (I²=62%); only after excluding one of them did a result favoring double-bundle appear: Fig. 18 is a risk ratio, RR 0.32 (95% CI 0.12–0.83), P=.02, with event counts of 5/143 for double-bundle and 17/152 for single-bundle; the body misprints the same result as MD [R08]. The Methods of that paper state in advance that heterogeneity would be explored by leave-one-out exclusion; performing a sensitivity analysis is not itself wrong. The problem is that the Abstract and Conclusions present only the result after exclusion. In the primary analysis, subjective scores, objective examination, and radiographic osteoarthritis did not differ; that part can be cited. The difference in complications can be relayed only together with the condition that it appeared after excluding one study, and cannot be treated as an established advantage of double-bundle reconstruction.
The osteoarthritis pooled analysis in the same paper (Fig. 14) double-counts. Karikis 2016 and Balasingam 2022 are entered as two studies, with weights of 14.0% and 29.2%, totaling 43.2% [R08]; they are the 5-year and 10-year reports of the same Swedish randomized cohort. The 14-year follow-up report of that cohort [R10] states in the first sentence of the Methods that the study is a mean 14-year follow-up of a previously reported cohort and lists those two papers as prior publications. Counting the same patients as two independent studies accounts for nearly half the weight of that pool; this judgment rests on the continuity of the original cohort and can be verified item by item; it is not an inference from shared authorship alone. The pooled RR of 0.76 (0.56–1.04) therefore cannot be used to judge the difference in osteoarthritis risk between double-bundle and single-bundle reconstruction; a pooled result after removing the double-counting can be obtained only by reanalysis.
Three further comparisons in that meta-analysis changed both bundle number and graft material at once [R08]. In Mohtadi 2019 the single-bundle arm mixed bone–patellar tendon–bone and hamstring tendon; Sasaki 2016 used hamstring for double-bundle and bone–patellar tendon–bone for single-bundle; Sun 2015 is recorded in that paper's table as 282 double-bundle and 142 single-bundle cases, with the graft column reading "HT, TAT allograft" on the double-bundle side and "TAT allograft" on the single-bundle side (by the table notes, HT is hamstring tendon and TAT is tibialis anterior tendon); the table does not state whether the hamstring tendon was autologous or allogeneic. Between-group differences in these three cannot be attributed entirely to bundle number.
The 2026 systematic review by Murakami et al. [R09] searched studies published from May 2016 through December 2023, included 20, with follow-up of at least 24 months, and reported results separately by design. In 11 interventional studies (664 patients; 8 randomized trials, plus 1 quasi-randomized and 2 prospective cohorts) no outcome showed a statistically significant difference; in 9 observational studies (1866 patients) the double-bundle group had less residual pivot shift (RR 0.42, 95% CI 0.30–0.60) and a slightly higher Lysholm score (MD 1.94, 95% CI 0.24–3.64). The minimal clinically important difference for Lysholm cited in that paper is 9.9 points; 1.94 is far below it and is insufficient to show an advantage patients can feel. The search start date of May 2016 was chosen because the review served an update of Japanese guidelines and earlier work had already been covered by the previous edition; results after the end of 2023 are not included.
Three long-term reports of more than ten years come from two independent randomized cohorts.
The Swedish cohort [R10] randomized 105 patients (53 double-bundle, 52 single-bundle), all with hamstring autograft and femoral tunnels drilled through an anteromedial portal; at a mean 14-year follow-up, 64 (61%; 29 single-bundle, 35 double-bundle) entered the final analysis. Pivot shift, Lachman, KT-1000, single-leg hop, range of motion, Lysholm, Tegner, and every radiographic osteoarthritis grade showed no significant between-group difference. Five patients in the double-bundle group underwent revision and none in the single-bundle group (P=.07); these 5 were not included in the final follow-up, and the authors list them as survivor bias in the Limitations.
The KOOS quality-of-life subscale is an exception: it was higher in the double-bundle group, with P=.042 in the body and P=.048 in the legend to Fig. 3; the authors state that the difference did not reach their threshold of clinical importance; the Abstract writes generically that KOOS subscales showed no significant differences [R10]. The two P values disagree, and the original does not say which governs; a positive result does exist, and reading only the Abstract would miss it. The paper also reports the proportions reaching the minimal clinically important difference: Sports/Recreation subscale 66% double-bundle versus 69% single-bundle (P=.81), Quality of Life subscale 85% versus 86% (P=.91). These are a different analysis from the between-group mean scores at follow-up and cannot substitute for one another.
The denominators for individual examinations are not all 64. Analyses involving side-to-side differences further excluded 6 contralateral ACL injuries and 1 contralateral total knee arthroplasty, leaving 23 single-bundle and 34 double-bundle patients [R10]. The 5 revisions had already been excluded, so revision rates cannot be calculated with 35 or 64 as the denominator. The trial was originally powered for pivot shift as the primary outcome and required 36 patients per group for 80% power; the final single-bundle group had only 29.
The Finnish cohort [R11] randomized 153 patients (78 single-bundle, 75 double-bundle); at 15 years, 100 (65%) had follow-up information and 55 (36%) entered the final clinical analysis. Revisions for graft failure numbered 13 (17%) in the single-bundle group and 5 (7%) in the double-bundle group, a nonsignificant difference. Both percentages use the originally randomized numbers as denominators, not the proportion among the 55 examined. The original states that prior failure records of those who did not attend the 15-year examination were retained, but nonattenders cannot be assumed free of failure, and loss to follow-up was unbalanced: those with information were 57/78 (73.1%) in the single-bundle group and 43/75 (57.3%) in the double-bundle group. In the same cohort at 2 years, failures were 1 double-bundle and 7 single-bundle, P=0.04. Significance at 2 years and nonsignificance at 15 years accompany accumulating events and shrinking numbers; the change in significance itself cannot prove that a treatment effect has disappeared. At 15 years the double-bundle group had better IKDC objective grades (P<0.001); subjective scores, KT-1000, pivot shift, range of motion, and single-leg hop did not differ.
In the 15-year radiographic report of the same Finnish cohort [R12], 101 had information and 56 entered the final imaging analysis; defining osteoarthritis as Kellgren–Lawrence grade ≥2, there was no difference between single-bundle and double-bundle.
Two sets of figures in that report that are unrelated to bundle number carry more weight for clinical decisions. Among the 56 patients who completed imaging analysis, osteoarthritic change was present in 59% of reconstructed knees and 21% of contralateral knees (P<0.001); among those who underwent partial meniscectomy for meniscal tear at the time of ACL reconstruction, 82% developed osteoarthritic change, versus 33% of those with isolated ACL injury (P<0.001) [R12]. Only bundle number was randomly assigned; meniscal injury and its management were not randomized, so the latter contrast is observational and cannot separate the contributions of initial injury severity, the resection itself, and other differences. The 59% is the proportion among the final 56, after excluding revisions, contralateral injuries, and total knee arthroplasties; it is not the long-term incidence in all 153. Under these conditions it still supports discussing management of meniscal injury before bundle number.
The Pittsburgh randomized trial [R13] enrolled active patients aged 14–50 years, required an ACL footprint 14–18 mm long, and used quadriceps tendon with a patellar bone block in both groups. Fifty-seven were randomized (29 double-bundle, 28 single-bundle); 51 (89.5%) completed 2-year follow-up, and no difference was detected in the primary outcome. Because of 5 patellar fractures related to harvesting the patellar bone block, the data and safety monitoring board permanently stopped further enrollment in December 2012 and approved follow-up of those already enrolled to the 2-year endpoint (the authors call the trial prematurely terminated in the Abstract conclusions). Of the 5 fractures, 2 occurred at harvest, 1 during isometric quadriceps testing at 6 months postoperatively, and 2 were asymptomatic occult fractures found on research CT at 6 months; the first 3 were in the single-bundle group and the last 2 in the double-bundle group; 1 underwent open reduction and internal fixation; all healed, 4 were asymptomatic at two years, and 1 had discomfort with prolonged standing and an IKDC score of 64.4. The original plan was to enroll 160 (expecting 136 for analysis); only 57 were actually randomized, so "no difference detected" cannot be read as proof of equivalence. These 5 cases also do not represent a general fracture rate for quadriceps tendon harvest: the study used a specific harvest technique, research CT actively discovered occult fractures, and there was no randomized comparison of bone-block versus soft-tissue-only harvest. At 2 years the proportions returning to the preinjury sport were 77.8% double-bundle and 83.3% single-bundle, with no difference detected, and Marx activity scores likewise did not differ [R13]; this outcome reflects only the reported proportion returning to the same preinjury sport and does not cover intensity or safety.
Taken together, no clinical outcome has yet shown a stable, reproducible, and clinically meaningful difference between single-bundle and double-bundle reconstruction. This is not the same as "all results are identical": positive results have appeared for the KOOS quality-of-life subscale, IKDC objective grade, and residual pivot shift in observational studies, but their magnitude, consistency, or study design is insufficient to change the choice. Discussion of the plan should focus on whether the tunnels are localized to that knee's own footprint, whether the footprint and notch dimensions allow a double-bundle reconstruction, and how meniscal injury is managed.
3. Autografts
Article 2 of the 2024 Chinese consensus on graft selection holds that each graft type has advantages and limitations and that there is currently no "gold standard" for graft choice; the surgeon should comprehensively consider graft size, biomechanical properties, tissue source, surgical habit and proficiency, and the patient's sex, age, injury characteristics, sporting demands, and personal preferences (strong consensus, 100%, 30/30) [R02]. The AAOS 2022 recommendation on autograft source is itself a trade-off: when performing autograft reconstruction in skeletally mature patients, the surgeon may prefer bone–patellar tendon–bone to reduce the risk of graft failure or infection, or prefer hamstring tendon to reduce anterior knee pain or kneeling pain (high-quality evidence; recommendation strength downgraded one level to moderate because of greater variation in hamstring graft size) [R01].
Hamstring Tendon versus Bone–Patellar Tendon–Bone
The meta-analysis by Zhao et al. that included only randomized trials with at least 5 years of follow-up [R17] (15 RCTs, 1298 patients; bone–patellar tendon–bone 610, hamstring tendon 688) provides a relatively complete set of results:
| Outcome | Effect size | Direction |
|---|---|---|
| IKDC objective score | OR 0.94 (0.64–1.37), P=.75 | No difference |
| Lysholm score | MD −2.26 (−4.56 to 0.05), P=.06 | No difference |
| Return to preinjury activity level | OR 1.01 (0.67–1.52), P=.96 | No difference |
| Tegner activity level | MD 0.03 (−0.36 to 0.41), P=.89 | No difference |
| Lachman test | OR 0.86 (0.56–1.32), P=.50 | No difference |
| Pivot-shift test | OR 0.68 (0.44–1.06), P=.09 | No difference |
| Side-to-side difference | MD −0.32 (−0.81 to 0.16), P=.19 | No difference |
| Flexion deficit | OR 1.09 (0.47–2.54), P=.85 | No difference |
| Radiographic osteoarthritic change | OR 0.76 (0.52–1.10), P=.15 | No difference |
| Kneeling pain | OR 1.67 (1.04–2.69), P=.03 | Less with hamstring |
| Anterior knee pain | OR 2.90 (1.46–5.77), P=.002 | Less with hamstring |
| Extension deficit | OR 1.75 (1.12–2.75), P=.01 | Less with hamstring |
| Graft failure | OR 0.59 (0.38–0.91), P=.02 | Less with bone–patellar tendon–bone |
The Tegner and Lachman rows in the table disagree with that paper's Abstract. Tegner is a mean difference, not an odds ratio: the Abstract and section 3.3.4 of the body write OR, whereas the header and axis of Fig. 6 are both "Mean Difference" [R17], and an interval with a negative lower bound cannot be an OR. The lower bound of the Lachman confidence interval is 0.56; the Abstract misprints it as 0.5, whereas section 3.3.5.2 of the body gives the complete 0.86 (0.56–1.32) [R17]. The 2022 official erratum of that paper corrects only the duplicated printing of Figs. 7 and 15 and does not correct these two points. In Table 4 the "side-to-side difference" row is word-for-word identical to the final "radiographic osteoarthritis" row (9 studies, I²=0%, fixed effect, 0.76 (0.52, 1.10), P=.15), a copy-paste error also not addressed by the erratum. These are labeling and typographic errors and do not affect the main conclusions in the table.
At mid-term follow-up the two grafts are essentially consistent in function, stability, and radiographic degeneration; the differences concentrate in two places: the cost of bone–patellar tendon–bone is anterior knee pain, kneeling pain, and extension deficit; the cost of hamstring tendon is more graft failures. Patients who need prolonged kneeling at work and young patients preparing to return to contact sports weight these two costs differently. Some of the trials included used earlier-era surgical techniques; the absence of a significant difference in radiographic osteoarthritis also cannot be inverted to show that either graft prevents osteoarthritis.
Quadriceps Tendon
The following three meta-analyses share some of the same primary randomized trials; the patient numbers cannot be added together.
The 2026 meta-analysis by White et al. that included only randomized trials [R18] (12 RCTs, 636 patients, search from 2004-07-26 to 2024-07-26) showed that, compared with hamstring tendon or bone–patellar tendon–bone, quadriceps tendon did not differ in graft failure, joint laxity, or multiple functional outcomes. The header of that paper's Fig. 3 is "Risk Ratio (Non-event)" and calculates the ratio of graft survival, not of failure [R18]; the Abstract's RR of 1.00 (95% CI 0.97–1.04) therefore cannot be read as proof that failure risk is the same for the three grafts. The failure analysis in fact covers only 6 studies and 429 patients: quadriceps tendon 6/215 (2.79%), and the control arm combining hamstring and bone–patellar tendon–bone 7/214. Separating the studies in the figure, hamstring was 5/159 (3.14%) and bone–patellar tendon–bone 2/55 (the original reports 3.6%). These are crude proportions, not a direct randomized comparison among three groups; with so few events they are also insufficient to support a conclusion of equivalence.
For harvest-site discomfort, the quadriceps group had 14/106 (13.2%) and the hamstring or bone–patellar tendon–bone group 42/103 (40.8%) [R18]. The gap is not small, but the same paper is inconsistent about the certainty of this evidence: page 7 of the body calls it high certainty, whereas the GRADE table on page 6 lists Moderate, with downgrading for serious indirectness [R18]; the headcounts also disagree, totaling 209 in Fig. 4 and 210 in Table 1. By the paper's own GRADE table, the certainty of this result is moderate.
The 2024 review by Raj et al. that included only randomized trials [R19] (7 papers, 474 patients, search to February 2024) found no differences at 24 months in patient-reported function, graft failure, or overall adverse events; harvest-site discomfort scores were lower with quadriceps tendon (MD −4.67, 95% CI −9.29 to −0.05, 2 studies, 211 patients, P=0.05), with low-to-moderate evidence quality.
The meta-analysis by Zhang et al. published in 2024 with a search only to July 2022 [R20] (21 studies, 2964 patients, including 3 randomized trials, 3 prospective studies, and 15 retrospective studies) reports: compared with hamstring tendon, quadriceps tendon had a lower failure risk (OR 0.46, 95% CI 0.23–0.93, P=0.031) and a smaller side-to-side difference (WMD −0.74, P=0.048); compared with bone–patellar tendon–bone, harvest-site pain was less (OR 0.16, 95% CI 0.10–0.24) and moderate-to-severe patellar-region symptoms during sport and work were less (OR 0.14, 95% CI 0.05–0.37). Pooled results dominated by retrospective studies cannot replace the cautious conclusions of the two preceding reviews that included only randomized trials; a later publication year also does not mean a more recent search.
Quadriceps tendon can be harvested with a patellar bone block or as soft tissue only; the costs of the two methods differ. The Pittsburgh trial used quadriceps tendon with a bone block and saw 5 patellar fractures among 57 cases, and therefore stopped further enrollment [R13]. When comparing data on "quadriceps tendon," the harvest method must first be distinguished.
Peroneus Longus Tendon
The meta-analysis by Desouza et al. that included only randomized trials and searched to December 2025 [R29] (4 RCTs, 407 patients; mean follow-up 18.75 to 19.5 months, with three inconsistent statements of follow-up length in the original) reports: compared with hamstring tendon, Lysholm and IKDC scores were similar, the modified Cincinnati score was higher (MD 3.02, P=0.0004), and harvest-site discomfort was less (OR 0.12, P=0.007). The paper has three problems that limit its use as evidence of an advantage for peroneus longus tendon.
The statement of significance for graft size contradicts the data. Page 7 of the original writes that mean graft size in the peroneus longus group (8.4 mm) was larger than in the hamstring group (8.13 mm) and that "this difference was statistically significant," yet the same parentheses give MD 0.28, 95% CI −0.44 to 1.01, P=0.45 [R29]. The pooled result in Fig. 8 is indeed MD 0.28 (−0.44 to 1.01), I²=96%, 2 studies, 282 patients, with no difference detected. "Peroneus longus tendon yields a thicker graft" therefore cannot stand as an established advantage, still less as a basis for inferring lower failure risk.
The pooled analysis of ankle function omitted the two studies with the largest declines. The AOFAS analysis in Fig. 10 compares postoperative with preoperative scores in the peroneus longus group: 4 studies totaling 210 patients, with 210 scores before and after surgery; Shair (40 patients) and Vijay (23 patients) are marked "Not estimable" and receive no weight [R29]. Both recorded a preoperative AOFAS of 100 with an SD of 0; the original does not explain why they are not estimable, yet the postoperative declines were largest precisely in these two (100 to 96.4; 100 to 96.43). The two that actually entered the pool (62 and 85 patients) gave MD −0.34 (−0.74 to 0.07), P=0.10. The conclusion that "AOFAS showed no significant postoperative decline" was therefore reached with the 63 patients who declined most (30% of 210) excluded from the pool. Page 10 of that paper also acknowledges that commonly used scores such as AOFAS have not necessarily been specifically validated for donor-site problems after peroneus longus harvest [R29].
Search completeness and failure outcomes cannot be verified. The PRISMA flow diagram shows: 632 records, 458 screened by title and abstract after deduplication, 143 requiring full text, of which 92 could not be obtained (64.3%), 51 entering full-text assessment, and 4 finally included [R29]. Those not obtained are not necessarily all eligible randomized trials, but nearly two thirds of the full texts were never assessed, so search completeness is in doubt; page 10 also acknowledges that the review was not prospectively registered in PROSPERO. None of the ten figures or any table in the full text gives event counts, denominators, effect sizes, or a forest plot for graft failure, so the statement of "similar failure" in the Abstract and Discussion cannot be verified within that paper.
This paper can show that peroneus longus tendon is an optional autologous source with less harvest-site discomfort; it should not be used to support advantages in stability, graft size, or failure rate, nor can it guarantee that harvest has no long-term effect on ankle and foot function. Dedicated discussion of peroneus longus tendon is in Section 9.2.1.
Graft Diameter and Age
Hamstring graft diameter is associated with failure risk; this is the starting point for some composite-graft designs. A meta-analysis cited by one study gives a relative risk of failure of 6.8 for grafts ≤8 mm in diameter (P=0.008) [R34]; another study cites registry data claiming that increasing diameter is associated with fewer revisions, but the value relayed does not state what kind of effect size it is, so the magnitude of the reduction in revision cannot be determined [R36]. All of these data come from observational studies. Diameter correlates with height, sex, and body habitus and acts jointly with age, activity exposure, and surgical technique. Age itself is an important correlate of failure: in the MOON cohort the adjusted OR for allograft was 3.97, and for every 10 years younger the OR for graft rupture was about 2 to 2.5; activity level in that cohort was collinear with age and could not be estimated separately (Section 4) [R21]. Taking insufficient diameter alone as a reason to add a particular material does not account for these factors.
Intra-articular Remodeling of the Graft
The systematic review by Janssen et al. integrating human and animal in vivo data [R04] (search 1982–2012; online 2013, formal volume 2014) divides intra-articular remodeling of hamstring tendon grafts into three phases: early healing (central necrosis of the graft, sparse cells, no detectable revascularization), proliferation (remodeling and revascularization most active), and ligamentization (structure approaching the properties of an intact ACL). Human biopsies show that cell density and vessel density are still rising within 24 months after surgery, myofibroblast density increases markedly between 13 and 24 months, and remodeling remains active at 1 to 2 years postoperatively; collagen fiber alignment did not return to normal within the observation period (up to 117 months after surgery); the collagen cross-link ratio still differed significantly from intact ACL at 6 months and became consistent only at 1 year, slower than in animal models [R04].
The Abstract of that paper writes that "neither biological nor biomechanical properties fully recover to those of the intact ACL"; page 4 further states that, in the absence of in vivo measurement techniques, no final conclusion can be drawn about the mechanical strength of healing human grafts [R04]. What has been directly observed in humans is structural change and its time course; the mechanical part comes mainly from animal experiments; the two sentences must be read together. One cannot on that basis assert that all autologous tendons never reach the strength of the native ACL over a lifetime. The authors accordingly question whether accelerated rehabilitation should be used after four-strand hamstring reconstruction. When comparing strength and recovery speed among different grafts, the same point applies: human graft strength cannot be measured in vivo.
4. Allograft Tendons
Allograft tendons come from donors, are processed and sterilized before use, and are biological tissue, distinct from synthetic materials. In the English literature, hybrid graft most often means autograft plus allograft (Section 6); confusing it with artificial material leads to misreading.
Article 4 of the 2024 Chinese consensus lists the trade-offs: advantages are no harvest-site complications, less trauma, less harvest-related pain, and shorter operative time; limitations are additional cost, slower healing, possible immune rejection, risk of disease transmission, difficulty controlling donor tissue quality, and a relatively higher failure rate in young athletic populations (strong consensus, 100%, 30/30) [R02].
Direct evidence comes from the MOON prospective multicenter cohort [R21]: a multivariable regression model was first built on 281 cases from a single surgeon and then validated on 645 cases from the remaining centers. The adjusted odds ratio for allograft rupture was 3.97 (95% CI 2.08–7.60), with the highest failure proportion in the 10-to-19-year age group.
The numerical statement of the age effect is written differently in three places in the original. The Abstract and body write that for every 10 years younger the odds of rupture are about 2.3-fold; Table 5 gives an OR of 0.40 (0.26–0.63) for every 10 years older, which inverted for every 10 years younger is about 2.50 (about 1.59–3.85); the annual coefficient of the model on the same page is −0.09, and exp(0.09×10)=2.46 [R21]. All three figures indicate that for every 10 years younger the OR for graft rupture is about 2 to 2.5. Candidate variables in the model were graft type, sex, age, body mass index, activity level at injury, meniscal tear, and primary versus revision; graft diameter was not included. The Marx activity score was dropped from the final model because of collinearity with age. The model therefore cannot separate the contributions of age and activity level, nor compare them with the contribution of diameter. This is an observational study; the odds ratio is not an individual's absolute incidence. Processing of allograft tissue (especially irradiation dose) affects mechanical strength [R02], so data from different eras and different tissue banks should not be compared directly; the cohort reflects North American practice of a particular period.
AAOS 2022 gives a strong recommendation on this point: ACL reconstruction should prefer autograft over allograft to improve outcomes and reduce failure rates, especially in young and/or highly active patients (high-quality evidence, strong recommendation) [R01].
5. Artificial Ligaments
Generations of Materials
Before the current PET artificial ligaments, Teflon, carbon fiber, Gore-Tex, polyester, Leeds-Keio, and the Kennedy ligament augmentation device were all used for ACL reconstruction and were later abandoned for their respective problems [R36]; early materials had high failure rates accompanied by synovitis, osteolysis, and premature joint degeneration [R41][R03]. The Chinese expert consensus lists "preconceived misconceptions" and "iatrogenic factors leading to surgical failure" side by side as the two major problems affecting standardized use [R03]. Failure experience with early materials cannot be applied directly to current devices, and favorable results with current devices cannot retrospectively prove that early criticisms were wrong.
Isometric Positioning
Anatomic reconstruction with biologic grafts targets the center of that knee's own insertion footprint for the tunnels. The first article of the Chinese expert consensus on new-generation artificial ligaments instead requires:
Reconstruction of the ACL with a new-generation artificial ligament must achieve "isometric" or "near-isometric" reconstruction, avoiding excessive stress on the graft during flexion and extension of the joint. The requirement for "isometric" or "near-isometric" positioning is higher when reconstructing the ACL with an artificial ligament than when reconstructing with a biologic graft. (High consensus, approval rate 100%, 26/26) [R03]
"Isometric" means that the distance between the inner apertures of the tibial and femoral tunnels remains constant or nearly constant through flexion and extension. The literature takes a change of less than 2 mm as the isometric standard; a domestic team measuring graft–tunnel slip through 0°–120° of knee motion after artificial-ligament implantation proposed a positioning method that keeps this distance within 1–2 mm, termed "near-isometric" [R03]. The rationale is material property: PET fibers lack extensibility; under nonisometric conditions they take excessive stress and impede flexion–extension, and repeated stress and impingement eventually lead to rupture; autologous or allogeneic tendons have higher viscoelasticity and tolerate nonisometric positioning to a degree [R03].
Three principal clinical studies of artificial ligaments all state that they used isometric positioning: the Huashan Hospital 10-year cohort and the four-center series drilled tunnels on isometric principles [R39][R43], and the Australian cohort writes directly "isometric (nonanatomic) position" [R41]. Artificial-ligament reconstruction and the anatomic reconstruction of Section 2 follow different targets for tunnel positioning; using artificial-ligament failure rates to evaluate the concept of anatomic reconstruction, or the reverse, lacks a shared premise. In the domestic 20-center follow-up of 1146 primary LARS reconstructions, 32 of 51 cumulative failures (62.7%) had clear bony-tunnel positioning errors, and the authors accordingly listed positioning error as the leading cause of artificial-ligament failure [R40]. The original also lists reinjury, screw loosening, and other potential failure causes; this ranking reflects the frequency of each problem among failed cases in that cohort, does not mean that every failure has only one cause, and cannot be extended directly to other artificial-material reconstruction cohorts.
The Inference from Failure Load to Return to Sport
Article 5 of the 2024 Chinese consensus on graft selection writes: the maximum mechanical strength (failure load) of LARS AC120 can reach 5500 N, 3.2 times that of the native ACL of an adult man (1730 N), 2.1 times that of a 10 mm–wide bone–patellar tendon–bone (2664 N), 2.3 times that of a 10 mm–wide quadriceps tendon (2352 N), and 1.3 times that of a four-strand hamstring tendon (4090 N); it then writes immediately, "Therefore, ACL reconstruction with LARS enables patients to recover rapidly and return to sport early" [R02].
This "therefore" lacks intermediate argument. Failure load is single-pull rupture strength ex vivo; this set of figures is cited from different sources, and the consensus document itself is not a testing report. Inferring from the ex vivo failure load of a particular model that patients can return to sport earlier skips the in vivo behavior of the graft–fixation–bone-integration construct, skips clinical trials comparing timing and safety of return, and skips whether other models and fixation methods apply. The consensus does not supply these grounds.
A high failure load does not contradict the same article's statement of "poorer elasticity": the former is the force needed to rupture, the latter is deformation under load—two different quantities; the consensus also does not say that stiffness is 3.2 times that of the native ACL. The same article continues that, because of poorer elasticity, clinical results depend highly on isometric or near-isometric technique, and bony-tunnel positioning error readily leads to failure [R02]. No matter how high the failure load, it cannot eliminate failures caused by poor positioning. In the Australian single-surgeon cohort at a median 7.8 years, all 15 graft ruptures confirmed at reoperation were located at the femoral tunnel aperture, and another 2 cases had a KT-1000 side-to-side difference >5 mm at follow-up, for a combined failure of 17/51 (33.3%) [R41]; among the 51 failures in the domestic multicenter series, 32 had clear bony-tunnel positioning errors [R40]. These two studies support the importance of positioning for artificial ligaments; they cannot be used to estimate how much material strength and positioning each contribute to patient outcome, and the consensus makes no such comparison.
This recommendation was developed as follows: the third-round meeting was held in a mixed online and offline format because of pandemic control; 30 experts voted by show of hands, with abstentions counted in the denominator; the recommendation received 100% agreement (30/30) and was listed as strong consensus [R02]. Consensus reflects the degree of expert endorsement, not comparative efficacy evidence; both consensus documents themselves state this.
Immediate Strength and Biological Outcome
Article 5 of the consensus describes current devices [R02]: advantages are high mechanical strength, no ligamentization process based on tissue regeneration after implantation, immediate attainment of the required mechanical strength, and avoidance of harvest-site complications and the pathogen-transmission risk of allogeneic tissue; limitations are poorer elasticity, clinical results highly dependent on isometric or near-isometric technique, bony-tunnel positioning error readily leading to failure, higher cost, uncertain long-term durability, and lack of biological integration.
Immediate mechanical strength and final biological outcome need separate evaluation. What the consensus describes is the material's initial mechanical properties, not the time-dependent behavior of the graft–fixation–tunnel construct in vivo. After implantation, autologous tendons undergo necrosis, proliferation, and ligamentization; human biopsies show active remodeling still at one to two years postoperatively [R04]; neither consensus nor the artificial-ligament clinical studies cited in this chapter reports measurements of artificial-fiber strength over time in the human body. On the material side, the consensus states that PET does not undergo the "necrosis–vascularization–remodeling" process of tissue regeneration [R02]; the 2022 technical consensus states that the effect of PET fiber aging on long-term clinical efficacy is "not yet clear and warrants attention" [R03]—a reservation from the document most supportive of this class of materials.
Clinical Results from Different Cohorts
| Study | Population and design | Follow-up | Failure / complications |
|---|---|---|---|
| Chinese 4-center retrospective series [R43] | 235 operations, 174 meeting inclusion, 159 completing follow-up (91%); 2004-08 to 2006-07; remnant preservation a prerequisite for use; Level of Evidence IV | Mean 50±6 months | Abstract: 3 artificial-ligament ruptures (1 with synovitis), overall complications 5.7% (9/159). Discussion separately gives cumulative failure 7/159 (4.4%), clinical failure defined as KT-1000 side-to-side difference >5 mm |
| Chinese Huashan Hospital prospective cohort [R39] | 133 cases (artificial 43, autograft 90); 2004-07 to 2007-12; usable remnant a prerequisite for artificial ligament, not used when remnant absent or of poor quality; Level of Evidence II | 10 years | Cumulative failure autograft 8.2%, artificial 7.9%, log-rank P=.910. Denominators are those contactable at 10 years (autograft 73, artificial 38), not the enrolled 90 and 43; ipsilateral radiographic osteoarthritis autograft 55.9%, artificial 50.0% |
| Chinese Artificial Ligament Research Group 20 centers [R40] | 1705 completing surgery, 1393 meeting inclusion, 247 lost to follow-up, 1146 completing follow-up; no autograft control | Median 87.1 months | Cumulative failure 4.5% (51/1146), complications 4.1% (47/1146); mild synovitis 1.6% (18/1146); 32 of 51 failures had bony-tunnel positioning error |
| Australian single-surgeon full cohort [R41] | 55 cases, 51 completing follow-up (93%); median age 36 years (19–58); isometric (nonanatomic) positioning, remnant preserved in all; Level of Evidence III | Median 7.8 years (6.0–9.4) | 15 graft failures confirmed at reoperation (15/55=27.3%), all at the femoral tunnel aperture; another 2 with KT-1000 side-to-side difference >5 mm on examination, combined 17/51 (33.3%) |
The 4.5% and 33.3% come from different failure criteria. Cumulative failure in the multicenter study includes arthroscopically confirmed graft rupture and clinical failure, the latter covering restricted range of motion (extension >5° or flexion >15°) and joint laxity (Lachman ≥grade II, pivot shift ≥grade II, side-to-side anterior tibial translation >5 mm) [R40]. Failure in the single-surgeon study has only two criteria: graft failure confirmed at reoperation, or KT-1000 side-to-side difference >5 mm at follow-up; Lachman does not appear in the full text, pivot shift appears only in describing the injury mechanism, and restricted range of motion is also not among the criteria [R41]. In the same population with the same examination methods, a wider set of criteria would usually count more failures; the multicenter study's criteria are wider yet the figure is much lower, and the two studies differ in population and examination methods, so the criteria cannot explain the direction of this gap. What can be established is that the two figures cannot be compared as risk under the same standard.
The two studies also differ in the following respects, whose separate contributions cannot be isolated from the available data. The pathways for detecting failure differ: the multicenter study followed patients by mail, telephone, and clinic visits and invited only those reporting discomfort back for detailed assessment [R40]; the single-surgeon study performed KT-1000 on all who attended and found 2 more beyond the 15 already confirmed failures [R41]. Asymptomatic laxity is more easily missed under the former approach. Denominators differ: the multicenter study had 247 lost to follow-up with unknown outcomes [R40]; the single-surgeon study's 15/55 and 17/51 use two denominators; the original does not give the intermediate value 15/51=29.4%, and when two percentages are listed side by side the denominators must be noted. Populations differ: median age 36 years in the single-surgeon cohort [R41], mean 31±7 years in the multicenter cohort [R40]. Remnant preservation is not a factor distinguishing the two sets of results: the single-surgeon study states clearly that all cases retained the native remnant, and those with poor remnant conditions were switched to autograft and excluded from that cohort [R41], as in several domestic studies.
The Abstracts of the two domestic studies lead readers to underestimate or be unable to verify failure data. The four-center series Abstract reports only "3 ruptures" and "complications 5.7%"; the cumulative failure rate of 4.4% (7/159) appears only in the Discussion [R43]. The Huashan cohort Abstract gives only the two percentages 8.2% and 7.9% without denominators; the denominators are the 73 and 38 contactable at 10 years, whereas enrollment was 90 and 43 [R39]. Another small error: the multicenter study Abstract writes a follow-up rate of 83.3%, whereas 1146/1393=82.3%; both the Chinese and English Abstracts and the body repeat this figure [R40].
The Huashan prospective cohort enrolled both a pure artificial-ligament group and an autograft tendon group and followed them for 10 years [R39]; among the studies discussed in this chapter, it provides a usable long-term direct comparison of the two; the Zhengzhou study [R06] also has a pure LARS arm, but its quantitative results cannot be used (Section 6). At 10 years in the Huashan cohort the cumulative failure rates of the two groups were nearly identical (8.2% versus 7.9%, P=.910). It is not a randomized trial; remnant condition determined who could receive an artificial ligament, so the two groups of patients were not fully comparable from the start. The artificial group scored higher on Lysholm at 6 months postoperatively (88.1 versus 83.0, P<.001), IKDC (86.9 versus 83.8, P=.036), Tegner (5.0 versus 3.7, P<.001), and Tegner at 1 year (6.5 versus 5.5, P=.011); other time points did not differ.
Synovitis and Histologic Findings of "Tissue Ingrowth"
A case report from Huashan Hospital [R42] provides direct histologic material. A 26-year-old man underwent LARS reconstruction at an outside hospital in April 2006; in October 2008, while lifting a heavy object, he had sudden pain and swelling, aspiration yielded abundant bloody fluid, and pain and swelling recurred thereafter; when seen in September 2009 he had a floating patella and positive anterior drawer and Lachman tests, and radiographs showed malposition of the femoral fixation screw. At revision arthroscopy there was abundant synovial hyperplasia with abundant hemosiderin deposition, the femoral tunnel was too anterior, and the ligament had ruptured near the tibial tunnel. Histology showed marked inflammatory reaction around the graft, with abundant multinucleated cells surrounding and entering between the graft fibers; the periphery of the graft was a thick band of fibrous scar tissue, and sparse, disordered collagen scar tissue infiltrated between the artificial-ligament fibers.
This case shows that a severe intra-articular reaction related to artificial material has indeed occurred and that symptoms can appear only years after surgery. A case report cannot estimate incidence and cannot prove a single cause: this case had tunnel positioning error, mechanical rupture, and tissue reaction at once. The actual morphology of "tissue ingrowth" in this failed explant was fibrous scar, not a neo-ligament; it is an explant after failure and cannot represent the human integration morphology of successful cases.
The synovitis rate of 1.6% (18/1146) reported by the multicenter study [R40] comes from a symptom-driven follow-up system and is insensitive to asymptomatic mild synovial change. Methods of judging synovitis differ greatly among studies—MRI semiquantitative scores, questionnaire items, and arthroscopic confirmation (Section 6)—so cross-study comparison of incidence has limited meaning.
Position in Guidelines
None of the recommendation or option items in the AAOS 2022 guideline addresses artificial/synthetic ligaments [R01]. The guideline covers history and physical examination, timing of surgery, single-bundle versus double-bundle, autograft versus allograft, autograft source, prevention training, ALL reconstruction / LET, repair versus reconstruction, and several "option" items; artificial-ligament literature appears only in the reference list. This does not mean the guideline judged artificial ligaments ineffective; rather, under its evidence framework no directional recommendation was formed. Related guidance in China comes from Chinese expert consensus [R02][R03].
Funding Sources and Author Relationships
Funding for several domestic artificial-ligament studies all came from government projects: the four-center series was funded by the 973 Program (2009CB930000) and the 863 Program (2007AA021902) [R43], the Huashan 10-year cohort by the National Key R&D Program (2016YFC1100300) and the 863 Program (2015AA033703) [R39], the 20-center survey by the National Natural Science Foundation of China (82172511) and the Shenzhen Sanming Project [R40], and the case report by the 973 Program and a Shanghai nano special project [R42]. The Australian cohort with the least favorable results states no funding and the authors declare no competing interests [R41].
The form of declaration differs among papers. The four-center series and the 20-center survey explicitly state that the authors declare no conflicts of interest [R43][R40]; the Huashan 10-year cohort uses the journal's disclosure-style column, namely "One or more of the authors has declared the following potential conflict of interest or source of funding," followed by listing of two national projects [R39], which is not the same kind of declaration as "the authors declare no conflicts of interest."
These papers overlap heavily in authorship and lead institutions: the corresponding author of the four-center series, the Huashan 10-year cohort, the 20-center survey, and the 2022 artificial-ligament technical consensus is the same person (Shiyi Chen, Huashan Hospital, Fudan University), and the first author of the 2024 graft-selection consensus is also the first author of the Huashan 10-year cohort. These are bibliographic facts that can be verified paper by paper and show that the studies come from interrelated teams; they are insufficient to conclude that patient data are not independent. Whether data are duplicated depends on the cohorts themselves: the meta-analysis in Section 2 double-counted the Swedish cohort on the basis of continuity of the original cohort and follow-up timing; no such continuity can be found among these domestic studies, and shared authorship alone is not evidence of duplication. The relatively optimistic domestic data, the multicenter safety survey, and the two consensus documents cited in this chapter come from the same team, so the weight of external independent replication is accordingly greater. The case report that described severe synovitis and performed histologic analysis [R42] also includes core members of that team; the patient's 2006 surgery was performed at an outside hospital, and the team undertook the revision and specimen analysis.
6. Autograft–Artificial Ligament Composites
Meaning of Hybrid Graft
In the English literature, hybrid graft in the great majority of cases is not autograft plus artificial. The 2024 meta-analysis by Fan et al. [R44] comparing hamstring autograft with hybrid graft (14 studies, 1411 patients, of whom 863 autograft and 548 hybrid; search to 1 July 2022) defines hybrid as the combination of a small-diameter hamstring autograft with allograft tendon and contains no artificial ligament. Failure rate (OR 0.99, P=0.97), side-to-side difference, IKDC subjective score, and Lysholm did not differ significantly; the authors recommend that surgeons preferentially obtain an adequately sized autograft by improving technique and reserve hybrid as a last choice.
The Tegner value in that paper's Abstract is wrong. Both the Abstract and the body write MD −0.88, yet the confidence interval given in the body is −0.35 to 0.19, so the point estimate falls outside its own interval; the actual value in Fig. 7 is MD −0.08 (−0.35 to 0.19), P=.56, 5 studies, 304 patients, whereas the body claims 7 studies and 503 patients [R44]. By Fig. 7 the Tegner difference is −0.08, and the conclusion of no significant difference is unaffected. Table 5 on page 10, stratified by mean age, also does not add up: the two strata total 14 studies, but the autograft denominators 419+582=1001 and the hybrid denominators 174+524=698 both exceed the overall 863 and 548, and the event counts 100 and 59 also disagree with the overall 97 and 55 [R44]. This subgroup table cannot be used as evidence.
Before a paper whose title contains hybrid graft is used to support "autograft plus artificial ligament," one must first confirm what is mixed. If the mix is allograft tendon, it has nothing to do with artificial-material composites; hybrid sometimes also means mixed fixation methods or mixed drilling techniques, which likewise cannot be appropriated.
Configurations
The table below lists only compositions explicitly described in the Methods of each original paper.
| Reference | Configuration | Composition as described in the original | Harvest |
|---|---|---|---|
| [R31] | Threading (autograft through artificial) | A hole is made just proximal to the junction of the extra-articular functional bundle and the woven portion of a 3.5 mm LARS ligament; the folded semitendinosus and gracilis tendons are passed through that hole, increasing graft diameter by about 1 mm; artificial and autograft together are passed through an Endo-Button loop and sutured | Two tendons harvested |
| [R30] | Mesh threading | The folded semitendinosus and gracilis tendons are passed through a LARS synthetic mesh, increasing size by about 1 mm; the open end of the mesh and the tendons are passed together through an Endo-Button loop and then sutured | Two tendons harvested |
| [R36] | Wrapping (artificial in the core, autograft outside) | A single strand of hamstring tendon of appropriate size is braided with a LARS internal-brace ligament and then folded into two strands, with the artificial material completely enclosed within the autologous tendon; both ends fixed with high-strength suture; final diameter 8 mm; single-bundle all-inside reconstruction | Authors state less harvest is possible |
| [R06] | Co-braiding | Semitendinosus, gracilis, and LARS artificial ligament braided together | Two tendons harvested |
| [R38] | Parallel suture augmentation | A short (<15 cm) or thin hamstring tendon is augmented with 3.5 mm LARS by web-stitch suture; final four-strand composite graft diameter 8–9 mm | Two tendons harvested; itself a remedy when tendon condition is inadequate |
| [R37] | Tubular device threaded | A tubular polyester synthetic device (JewelACL, Xiros, UK) combined with gracilis tendon; the tendon is passed through the tubular mesh to make a 4×2-strand graft; all-inside primary reconstruction | Gracilis only |
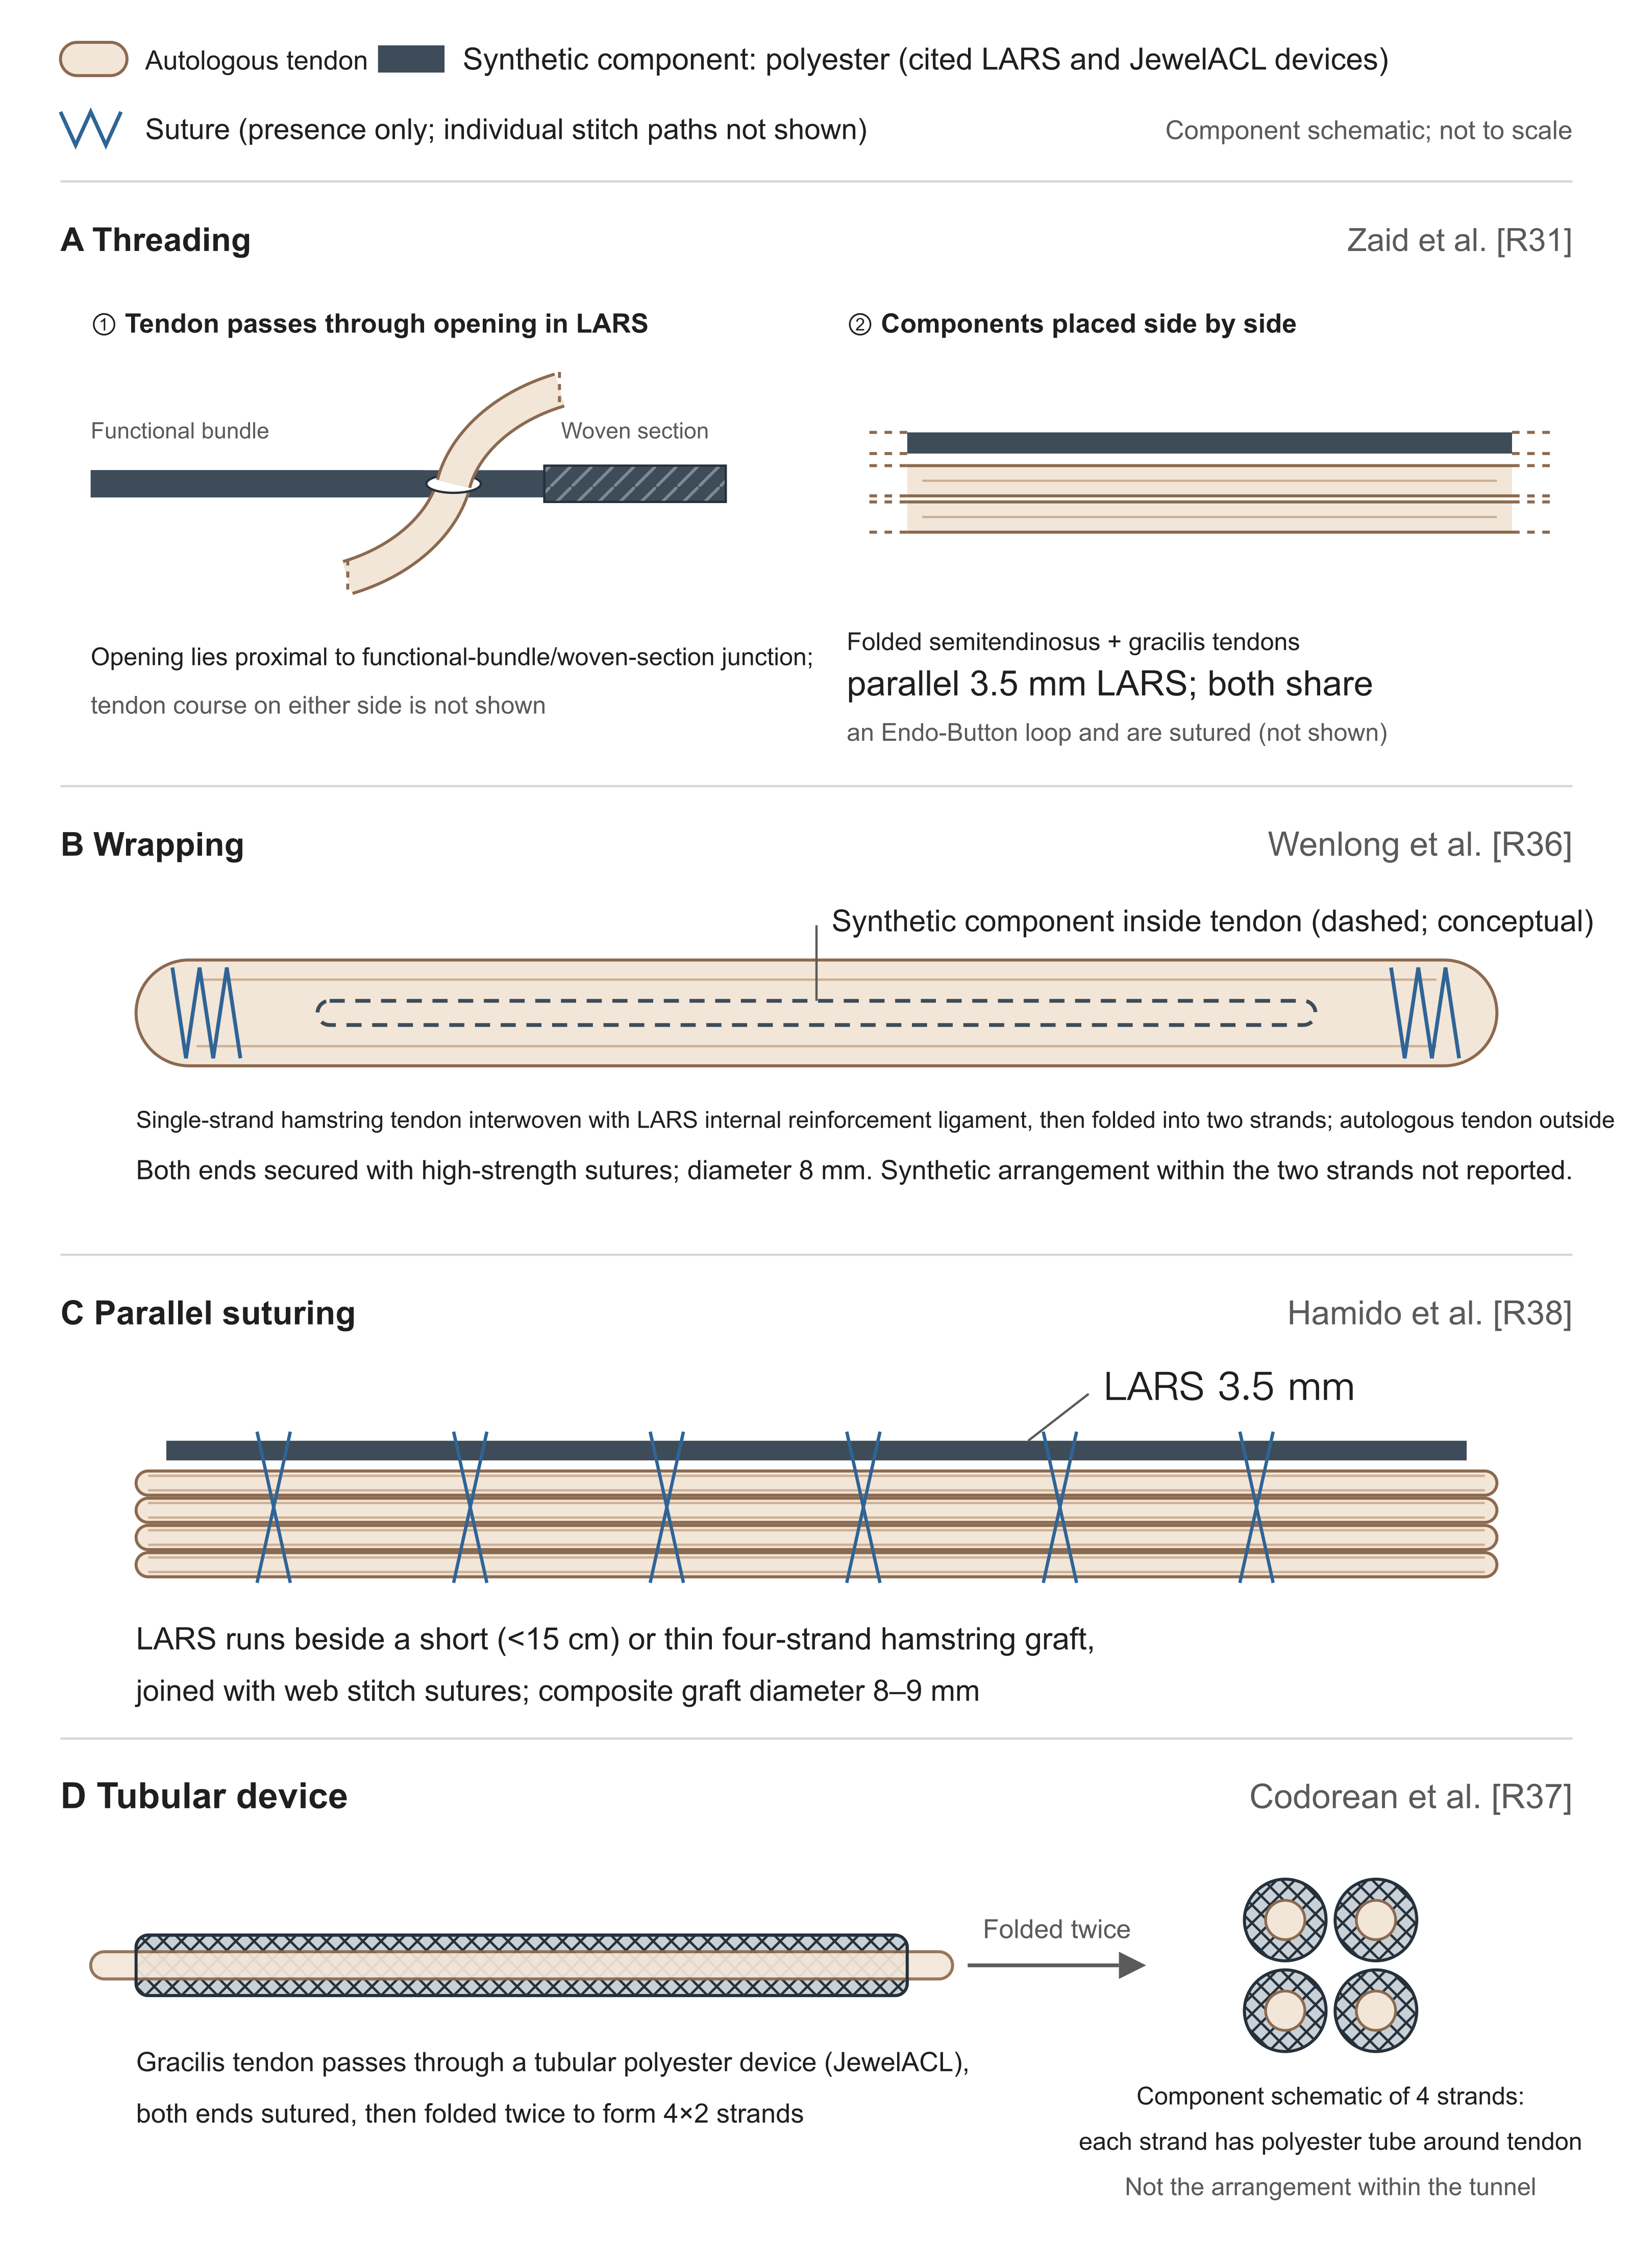
Figure 1. Four autograft–artificial composite configurations
The artificial components in the figure are all polyester materials, including LARS and the JewelACL device. A. Threading (Zaid et al. [R31]): ① the folded semitendinosus and gracilis tendons pass through the hole made in a 3.5 mm LARS just proximal to the junction of the functional bundle and the woven portion; ② the two run in parallel. The original also writes that both are hung together on an Endo-Button loop and sutured, which is not drawn in the figure; the course of the tendons on either side of the hole is not described step by step in the original and is truncated with dashed lines. B. Wrapping (Wenlong et al. [R36]): a single strand of hamstring tendon is braided with a LARS internal-brace ligament and then folded into two strands; the outer layer is autologous tendon and the artificial component lies within; the specific arrangement of the artificial component within the two strands is not stated in the original, and dashed lines only indicate that it lies inside. C. Parallel suture (Hamido et al. [R38]): 3.5 mm LARS runs parallel to a four-strand hamstring tendon and is sutured with web stitch; crossing lines indicate only that suturing is present, not the needle-by-needle path. D. Tubular device (Codorean et al. [R37]): gracilis tendon is threaded into a tubular polyester device and folded twice into 4×2 strands; the circle on the right is a schematic of component relationships drawn from the preparation text and does not represent arrangement within the tunnel. The Xiamen mesh configuration [R30] is described in the original similarly to A, with a synthetic mesh replacing the strip; the Zhengzhou study [R06] states only that the three components are braided together; neither specifies the geometric relationships among components, and neither is drawn in the figure. The panels are not to scale.
[R31] and [R30] write the augmented specification as "total cross section about 8 mm²." An area of 8 mm² corresponds to a diameter of about 3.2 mm, which matches neither the same papers' "diameter increased by about 1 mm" nor a conventional 8 mm–diameter graft; unit or wording error is suspected and is recorded here as printed. The configurations in the two Australian studies also differ: the "LARS-augmented" reconstruction in the 7-year study was an anatomic double-bundle reconstruction in which only the AM bundle used a folded LARS 133 (product number 104.133) sharing a single 20 mm Endo-Button loop with a folded semitendinosus, and the PL bundle was gracilis alone [R33]; the 8–11-year study added LARS alongside a four-strand hamstring [R34].
These configurations differ in three respects. Component in contact with the bony tunnel: the Shandong study emphasizes that the outer autologous tendon contacts the bony tunnel directly, favoring tendon–bone healing [R36], whereas in threading and parallel-augmentation configurations some artificial material is exposed directly to the tunnel. Amount of autologous tissue harvested: [R36] and [R37] claim that less can be taken; [R06][R31][R30][R38] all harvested two hamstring tendons. Proportion occupied by the artificial component: a 3.5 mm LARS strip [R31][R38] and an internal-brace ligament completely enclosed within autograft [R36] differ substantially in cross-sectional share. Clinical results for one configuration cannot automatically be extended to another.
Positioning standards are also not uniform. When the same graft contains both autologous and artificial components, whether positioning follows anatomic or isometric requirements is stated differently across studies: the two Xiamen studies write that the femoral tunnel is prepared through an anteromedial portal to allow anatomic positioning [R30][R31]; the Shandong study writes femoral localization at the 1-o'clock or 11-o'clock position to correspond to the AM-bundle insertion [R36]; the Romanian technical paper writes that the femoral tunnel is drilled in an isometric position and the tibial tunnel prepared in an anatomic position [R37]. Existing wording is insufficient to confirm whether the tunnels actually drilled differed, and one cannot conclude from wording alone that the two requirements are incompatible; what can be established is that these studies are inconsistent in how they describe positioning, so their results are difficult to compare directly; and in the domestic multicenter cohort of pure artificial-ligament reconstruction, the most common problem among failed cases was precisely bony-tunnel positioning error [R40].
The article by Codorean et al. from Romania [R37] is a 2026 technical paper in Arthroscopy Techniques; the body names specific commercial devices (JewelACL, Xiros; tibial and femoral suspension loops ToggleLoc by Zimmer Biomet) and appends a table of advantages and disadvantages. The declarations column on page 8 states that the authors have no known competing interests; the video cover on page 2 states that the first author is an unpaid consultant for Zimmer Biomet and that the remaining authors have no conflicts of interest. Both statements coexist; an unpaid consultancy is not the same as industry funding of the study and cannot on that basis support an inference that the data are wrong. Naming materials and listing advantages and disadvantages is required for a technical description and need not therefore be treated as a product brochure; but such articles do not provide evidence of efficacy and cannot be used to prove low failure rates, low synovitis rates, or earlier return. Self-listed disadvantages in the text include the need for precise tension control to avoid stress mismatch between the two components, and uncertainty about long-term integration or wear of the synthetic material.
Three Australian Studies: Mid- to Long-Term and Two-Year Data
Study with at least 7 years of follow-up [R33]: from 2009 to 2011 a single surgeon performed 211 cases (104 autograft, 107 composite); final clinical assessment covered 136 (69 autograft, 67 composite), and 75 (35% of the target cohort) did not participate; of the 136 assessed, 112 (56 each) underwent MRI and 24 refused. Group assignment was by patient self-selection at informed consent, not randomization.
The title writes "without evidence of synovitis or early osteoarthritis," which taken literally is easily read as meaning that no synovitis was observed. The tables show that 20 of 56 in the autograft group (35.7%) and 21 of 56 in the composite group (37.5%) had abnormal synovial features on MRI, and the mean synovial scores of both groups were 0.4±0.6 [R33]. This item is a 0–3 semiquantitative index within the WORMS scoring system, defined as a combined grade of synovial thickening and effusion, with 0 normal and 1, 2, and 3 corresponding to different degrees of potential maximal expansion of the joint cavity [R33]; it is not symptomatic synovitis, nor particle-induced synovitis confirmed at arthroscopy. The printed means and SDs of the two groups are identical, and the proportions with positive features, 35.7% and 37.5%, show no between-group difference detected. What the study supports is that no additional increase attributable to LARS was detected—not that "no one showed synovial findings," and not that "complete absence of increase has been proved." Copying the title leads readers to think the MRI was entirely normal; writing conversely that "one third developed synovitis" is equally distorting. WORMS total scores were 12.3 (11.5) for autograft and 16.7 (19.9) for composite, with no significant difference.
The influence of the title can be traced: the 2026 meta-analysis by Antzoulas et al. summarizes on page 7 that "MRI and arthroscopy showed no synovitis, infection, or graft-related degeneration" [R35], and the study it included is precisely this one; a title phrasing becomes a stronger conclusion in secondary literature.
On retear, that paper reports ipsilateral reinjury of 7/79 (8.8%) in the autograft group and 9/79 (11.3%) in the composite group [R33]. The denominator 79 is composed of those who completed assessment (69 autograft, 67 composite), those excluded for revision (6, 8), and those excluded for contralateral ACL reconstruction (4, 4); the original cohort had 104 autograft and 107 composite, so a further 25 in the autograft group and 28 in the composite group (53 in total) did not enter this assessment because of refusal, relocation out of state or overseas, or inability to contact, and the original does not report their outcomes. The two proportions were obtained with these 53 not counted; the direction of bias cannot be judged. Ipsilateral reinjury in the composite group was numerically higher than in the autograft group; both groups had few. Those already revised for retear were not in the final functional assessment (and 1 in each group was an asymptomatic retear found on MRI of those who did attend), so "function of the finally surviving grafts is similar" and "overall failure risk of the two groups is similar" are two different questions.
The study was funded for research by Corin and simultaneously declares no conflicts of interest [R33]. The authors' conclusion is that composite and pure autograft results were equivalent, and that because of the lack of further benefit and the added cost these results do not provide a rationale for additional use of synthetic augmentation; they also state that the higher failure rates, synovitis, and early osteoarthritic change reported in prior literature were not observed in this cohort [R33].
Eight-to-11-year study [R34]: from December 2012 to March 2017 a single surgeon performed 105 cases; 102 could be contacted (70 composite, 32 autograft), with mean follow-up of 9 years 1 month. Revision rates for ACL failure were 5.7% (4/70) composite and 12.5% (4/32) autograft, OR 0.4 (95% CI 0.1179–1.555), P=0.255, nonsignificant; all 8 revisions occurred after reinjury following return to full sport.
This study had no industry funding. The funding statement writes that the study received no specific funding from any public, commercial, or nonprofit agency [R34], and Corin does not appear in the full text. Those funded by Corin were the 7-year study above and the Australian two-year cohort [R33][R32]; calling all three Australian studies industry-funded is inaccurate.
Assignment was not random, and the difference between groups was not age alone. The Methods state that LARS was added only when four-strand hamstring thickness was inadequate [R34]; the two groups differed from the start in tendon condition, which may have left the composite group with poorer baseline conditions; the direction of bias cannot be assumed. The same cutoff is inconsistent in three places in the original: page 2 Methods write "less than 7.5 mm," page 3 Discussion "7.5 mm or less," and page 4 Limitations "7 mm or less" [R34]. Mean ages differed by 6 years (autograft 27 years, composite 33.07 years, P=0.008).
The method used to assess synovitis needs to be specified. The original writes that, for lack of a reliable noninvasive method of detecting synovitis, the pain and swelling items of the Lysholm knee score (called the Tegner Lysholm score in the original) were used as surrogate markers of synovial change; the result was that "the coexistence of persistent pain and persistent swelling was not observed in either group" [R34]. What was actually reported was 1 case of persistent swelling (composite group, already returned to full sport) and 3 of persistent pain (2 composite, 1 autograft); simply no one had both. Using simultaneous appearance of two questionnaire items as the diagnostic criterion is not at the same evidence level as the MRI semiquantitative score of the preceding study or as arthroscopic confirmation. The Abstract conclusions write that "LARS can ensure an appropriately sized graft and in the 8-to-11-year follow-up of our cohort was safe and not accompanied by synovitis." This conclusion applies only to the 8-to-11-year follow-up of that cohort. This "safe" rests on data from 102 cases that were retrospective, nonrandomized, with addition of LARS depending on tendon thickness, and with a 6-year age difference between groups, and synovitis judged by simultaneous appearance of two questionnaire items; under such a judgment method, "not accompanied by synovitis" can show only that none was found by that standard, not that no synovial reaction occurred inside the joint.
Follow-up intensity is also out of keeping with a title of "8-to-11-year results": the Methods write follow-up as clinic visits at 2 weeks, 6 weeks, and 3 months postoperatively, plus a single telephone follow-up at study close [R34]; long-term outcomes rest mainly on that one call. The paper also mis-cites the four-center series: page 3 says 3 cases of synovitis among 159, and page 4 of the same citation writes 1 synovitis and 3 ruptures [R34]; the original is in fact the latter [R43].
Two-year cohort [R32]: retrospective comparison, 66 composite and 130 autograft, surgery from April 2014 to December 2017, Level of Evidence III. At 1 year the composite group had higher Tegner (P=.001), return to Noyes grade 1 or 2 sport 81.8% versus 66.2% (P=.029), and return to preinjury level 51.5% versus 28.5% (P=.003); at 2 years these between-group differences were no longer detected (return to preinjury level 60.6% versus 49.2%, P=.173). At 2 years there was also a result in the opposite direction: in Table 2 the KOOS Activities of Daily Living subscale was 99.1±2.3 for autograft and 97.1±7.8 for composite, P=.007, higher in the autograft group, and the body also notes this exception [R32]. The gap is about 2 points and near the ceiling of the scale; whether it has clinical meaning cannot be judged from the P value alone. Those with retear were excluded from the final analysis cohort, as in the two preceding studies. The study was funded by Corin and the Hollywood Private Hospital Research Foundation (RF070) [R32].
Early-Outcome Studies
Shandong study: configuration clearly described; conclusions exceed the data. The single-center, single-blind, quasi-randomized study by Wenlong et al. [R36] enrolled 99 patients (48 composite, 51 autograft; enrolled 2023–2024; same surgeon); the configuration is the most clearly described among this set of papers (Fig. 1B); the authors state that the design can reach 8 mm with less tendon harvest.
Follow-up reached only 6 months. The composite group scored higher on Lysholm, KOS-ADLS, and IKDC at 1 month, on Tegner, Lysholm, and KOS-ADLS at 3 months, and on Tegner at 6 months; ACL-RSI, reflecting psychological readiness, showed no between-group difference at 1, 3, or 6 months, and Lachman, anterior drawer, and pivot-shift examination also did not differ at 3 months [R36]. Higher scores and readiness to return to sport are two different things; the study's own data already show this.
The original has several internal inconsistencies. The column headers of Table 1 on page 3 are composite 48 and autograft 51, but the three "mechanism of injury" rows add to 36+12+3=51 in the composite column, with percentages also using 51 as denominator, and to 38+6+4=48 in the autograft column, with 48 as denominator [R36]; the two columns are likely reversed in print, and which is the true value cannot be decided on the authors' behalf. Table 2 on page 5 records 48 autograft and 46 composite at 3 months (94 in total), yet Table 3's examination at the same time point records 51 autograft and 48 composite (99 in total) [R36]; the body states that 5 were lost at 3 months, and the original does not explain why the examination still has 99. Page 9 Results write that 1 early wound infection in the autograft group resolved after 2 weeks of oral antibiotics, yet page 10 Discussion writes "no patient developed any postoperative complication" [R36]—a direct conflict within the same article.
Significance markings in the Abstract and Table 2 also disagree. The Abstract states that at 1 month Lysholm, IKDC, and KOS-ADLS all had P<0.01, and at 3 months Tegner, Lysholm, IKDC, and KOS-ADLS all had P<0.05 [R36]. For the 1-month set the difference is only in the fineness of the asterisks (P<0.01 versus P<0.05 do not conflict); what does not match is 3-month IKDC, which the Abstract lists as significantly different, yet that cell in Table 2 has no asterisk, and the Results narrative on page 8 also does not count it among the outcomes that differed at 3 months. On sample size, the study calculated separately for Tegner score (expected difference 0.8, SD 1.2) and other scores (expected difference 5, SD 8) at power 0.8, yielding 37 and 42 per group, and after allowing for 10% loss to follow-up set a minimum enrollment of 46 per group; actual enrollment was 48 and 51, with 43 and 44 remaining at 6 months, all not below the numbers needed for analysis, but the 6-month loss rates of both groups (about 10.4% and 13.7%) exceeded the preset 10%.
The bench portion used bovine tendon in place of human hamstring for tensile testing, with 3 tests in each of three groups. Maximum loads were 1671.8±154.62 for tendon alone, 2410±111.36 for tendon + LARS, and 2551.6±64.38 for LARS alone; elongations were 7.30±1.54, 5.13±0.64, and 5.216±0.80 in that order; tendon + LARS and LARS alone did not differ significantly [R36]. Neither Table 4 nor Fig. 8 labels units; values are recorded here as in the original table. If 3 tests per group means n=3, a one-way ANOVA on elongation from the means and SDs of Table 4 yields F(2,6)≈3.97, P≈0.08, which does not support an overall P<0.05; the original does not state sample independence or the method of post hoc comparison; this is a testing question that needs author clarification and cannot be used to declare the asterisks in the figure wrong outright.
The animal portion used 12 New Zealand White rabbits, combining extensor digitorum longus tendon with LARS, observed at 4 and 8 weeks. At 4 weeks postoperatively the artificial fibers were enveloped by fibrous connective tissue with visible neovessels between them, but gaps remained between the artificial material and collagen fibers; at 8 weeks infiltration increased and gaps narrowed [R36]. The experiment had no animal control of pure autograft or pure LARS, so calling the histology "superior to traditional methods" lacks a direct comparison; 4 and 8 weeks in the rabbit also cannot be converted into human rehabilitation or return-to-sport times.
On cost, page 10 writes that "in this study the reinforcing ligament performed excellently, with no failures and few complications, thereby reducing costs related to retreatment and revision surgery" [R36]. The study collected no cost data whatever, and 6 months is also insufficient to judge long-term revision cost. The paper did perform telephone follow-up of all 99 operated patients covering complications, reoperation, and graft failure, and reports no ligament laxity, infection, synovitis, tunnel enlargement, or rupture beyond the 1 infection above [R36], so one cannot say it did not observe failure outcomes; the problem is that the observation period did not exceed 6 months, the method was nonstandardized telephone inquiry, and there were no cost data at all. The study was funded by the Shandong Natural Science Foundation (ZR2021MH264) and declares no commercial or financial relationships [R36].
Two Xiamen studies: early scores better, but flow and statistics do not add up. The same team at the First Affiliated Hospital of Xiamen University published two studies. The earlier [R31] is a prospective comparative cohort of 178 enrolled from January 2018 to December 2019 (89 each; journal Level of Evidence II); the later [R30] is titled and abstracted as a prospective randomized clinical study, 141 patients in three groups (47 each), with patient selection from January 2014 to April 2023, and lists the earlier paper as a reference. The enrollment periods of the two overlap; whether they include the same patients has not been confirmed; without patient-level evidence one cannot write that duplication has been confirmed.
The activity-return P values of the earlier study cannot be obtained from its own headcounts. The original reports: at 6 months, those participating by Noyes grade in grade 3 (1–3 times per month) sports involving cutting, twisting, and jumping were 75/84 (89.3%) versus 49/84 (58.3%), P=0.02; at 12 months those reaching the higher-frequency grade 1 were 75/80 (printed 93.6% in the original, actually 93.75%) versus 59/81 (72.8%), P=0.03; at 24 months 76/78 (97.4%) versus 69/80 (86.3%), P=0.246 [R31]. Recalculating with a two-sided Fisher exact test from the headcounts given in the original yields P approximately 0.0000073, 0.00054, and 0.0175 in turn—all three disagree with the original, and the last also changes the judgment of significance: the original says the difference was no longer significant at 24 months, yet calculation from its own numbers is significant. The Methods mention only t tests for clinical indices and Pearson chi-square for arthroscopic indices and do not describe a model or adjustment that could yield these three P values. In addition, one place in the body at 6 months writes 84 in the autograft group, whereas the table has 83. These disagreements do not show that the authors' error has already been identified, and recalculated values cannot replace the official study values; what can be established is that the temporal pattern "composite group returned to activity earlier, no longer significant by 24 months" cannot be supported from the paper's own numbers.
Problems in the later study are more concentrated. Failure figures appear in four places, with three versions of within-group counts: the Abstract writes 8.5%/12.8%/4.3% (i.e., 4/6/2 by 47 per group, 12 total); page 8 Results write "a total of 11 (7.8%) developed graft failure," then list group counts of 3/4/2 (9 total); page 11 Discussion writes 6.4%/8.5%/4.3%, corresponding to 3/4/2; Table 7 on page 10, stratified by tunnel position, has success/failure counts totaling 4/5/2 (11 total) [R30]. In that sentence on page 8 the same triplet (3, 4, 2) is also used twice in succession, once for graft failure and immediately once for contralateral knee reinjury; the original does not say whether this is coincidence or a transcription error.
The patient flow also does not add up. Page 6 starts from 141 and subtracts 4, 5, 7, 2, and 3 in turn; the final figure should be 120, yet the original writes 137, 132, 125, 122, 118, and 125 minus 2 does not equal 122, nor 122 minus 3 equal 118; the claimed 21 lost also does not equal 141 minus 118 = 23 [R30]. The CONSORT flow diagram on page 4 and the body on page 6 disagree at two long-term time points, and the flow diagram also lists a "24-month follow-up" time point for the mesh group, whereas the follow-up plan elsewhere in the full text is 6, 12, and 18 months plus 3 and 8 years. In Table 7 on page 10 the four cells for femoral position in the LARS group add to 21+0+19+4=44, which does not match the 47 in that group. Page 8 of the body writes that "poor femoral tunnel position was significantly associated with cumulative failure (P>0.05)," yet the three P values in Table 7 are 0.031, 0.012, and 0.046 [R30]. The title writes "2- to 8-year follow-up"; the Abstract methods and outcome-assessment sections write that final follow-up was between 3 and 8 years.
None of the failure rates in this paper can be cited; the patient flow is unclear, and clinical outcomes at each time point must also be viewed with reservation. What can still be used are the design and configuration descriptions, and the second-look arthroscopic findings: 27 in the LARS group, 24 in the autograft group, and 28 in the mesh group underwent second-look arthroscopy, with no significant differences among the three groups in graft tension, tear, or synovial coverage [R30]. The study declares no funding and no conflicts of interest [R30].
Zhengzhou study: the numbers in the tables cannot hold simultaneously. The retrospective comparison by Cao et al. [R06] enrolled 132 patients, 44 per group; it is direct domestic material on the "co-braiding" configuration and reports higher scores and earlier return to sport in the composite group. Its scores and recovery times cannot serve as evidence of between-group superiority.
Page 3 of that paper (printed page 3283) gives Lysholm grade cutoffs: excellent >95, good 95≥score>86, fair 86≥score>66, poor ≤66. In Table 3 on page 4 (header marked x̄±s, n=44) the autograft group's Lysholm at 2 years postoperatively is 81.35±2.21; Table 4 on the same page records among the same 44: excellent 19, good 11, fair (Table 4 uses "fair/acceptable") 8, poor 6; the four grade counts add exactly to 44, and the excellent–good rate 30/44=68.18% matches the table totals and percentages [R06].
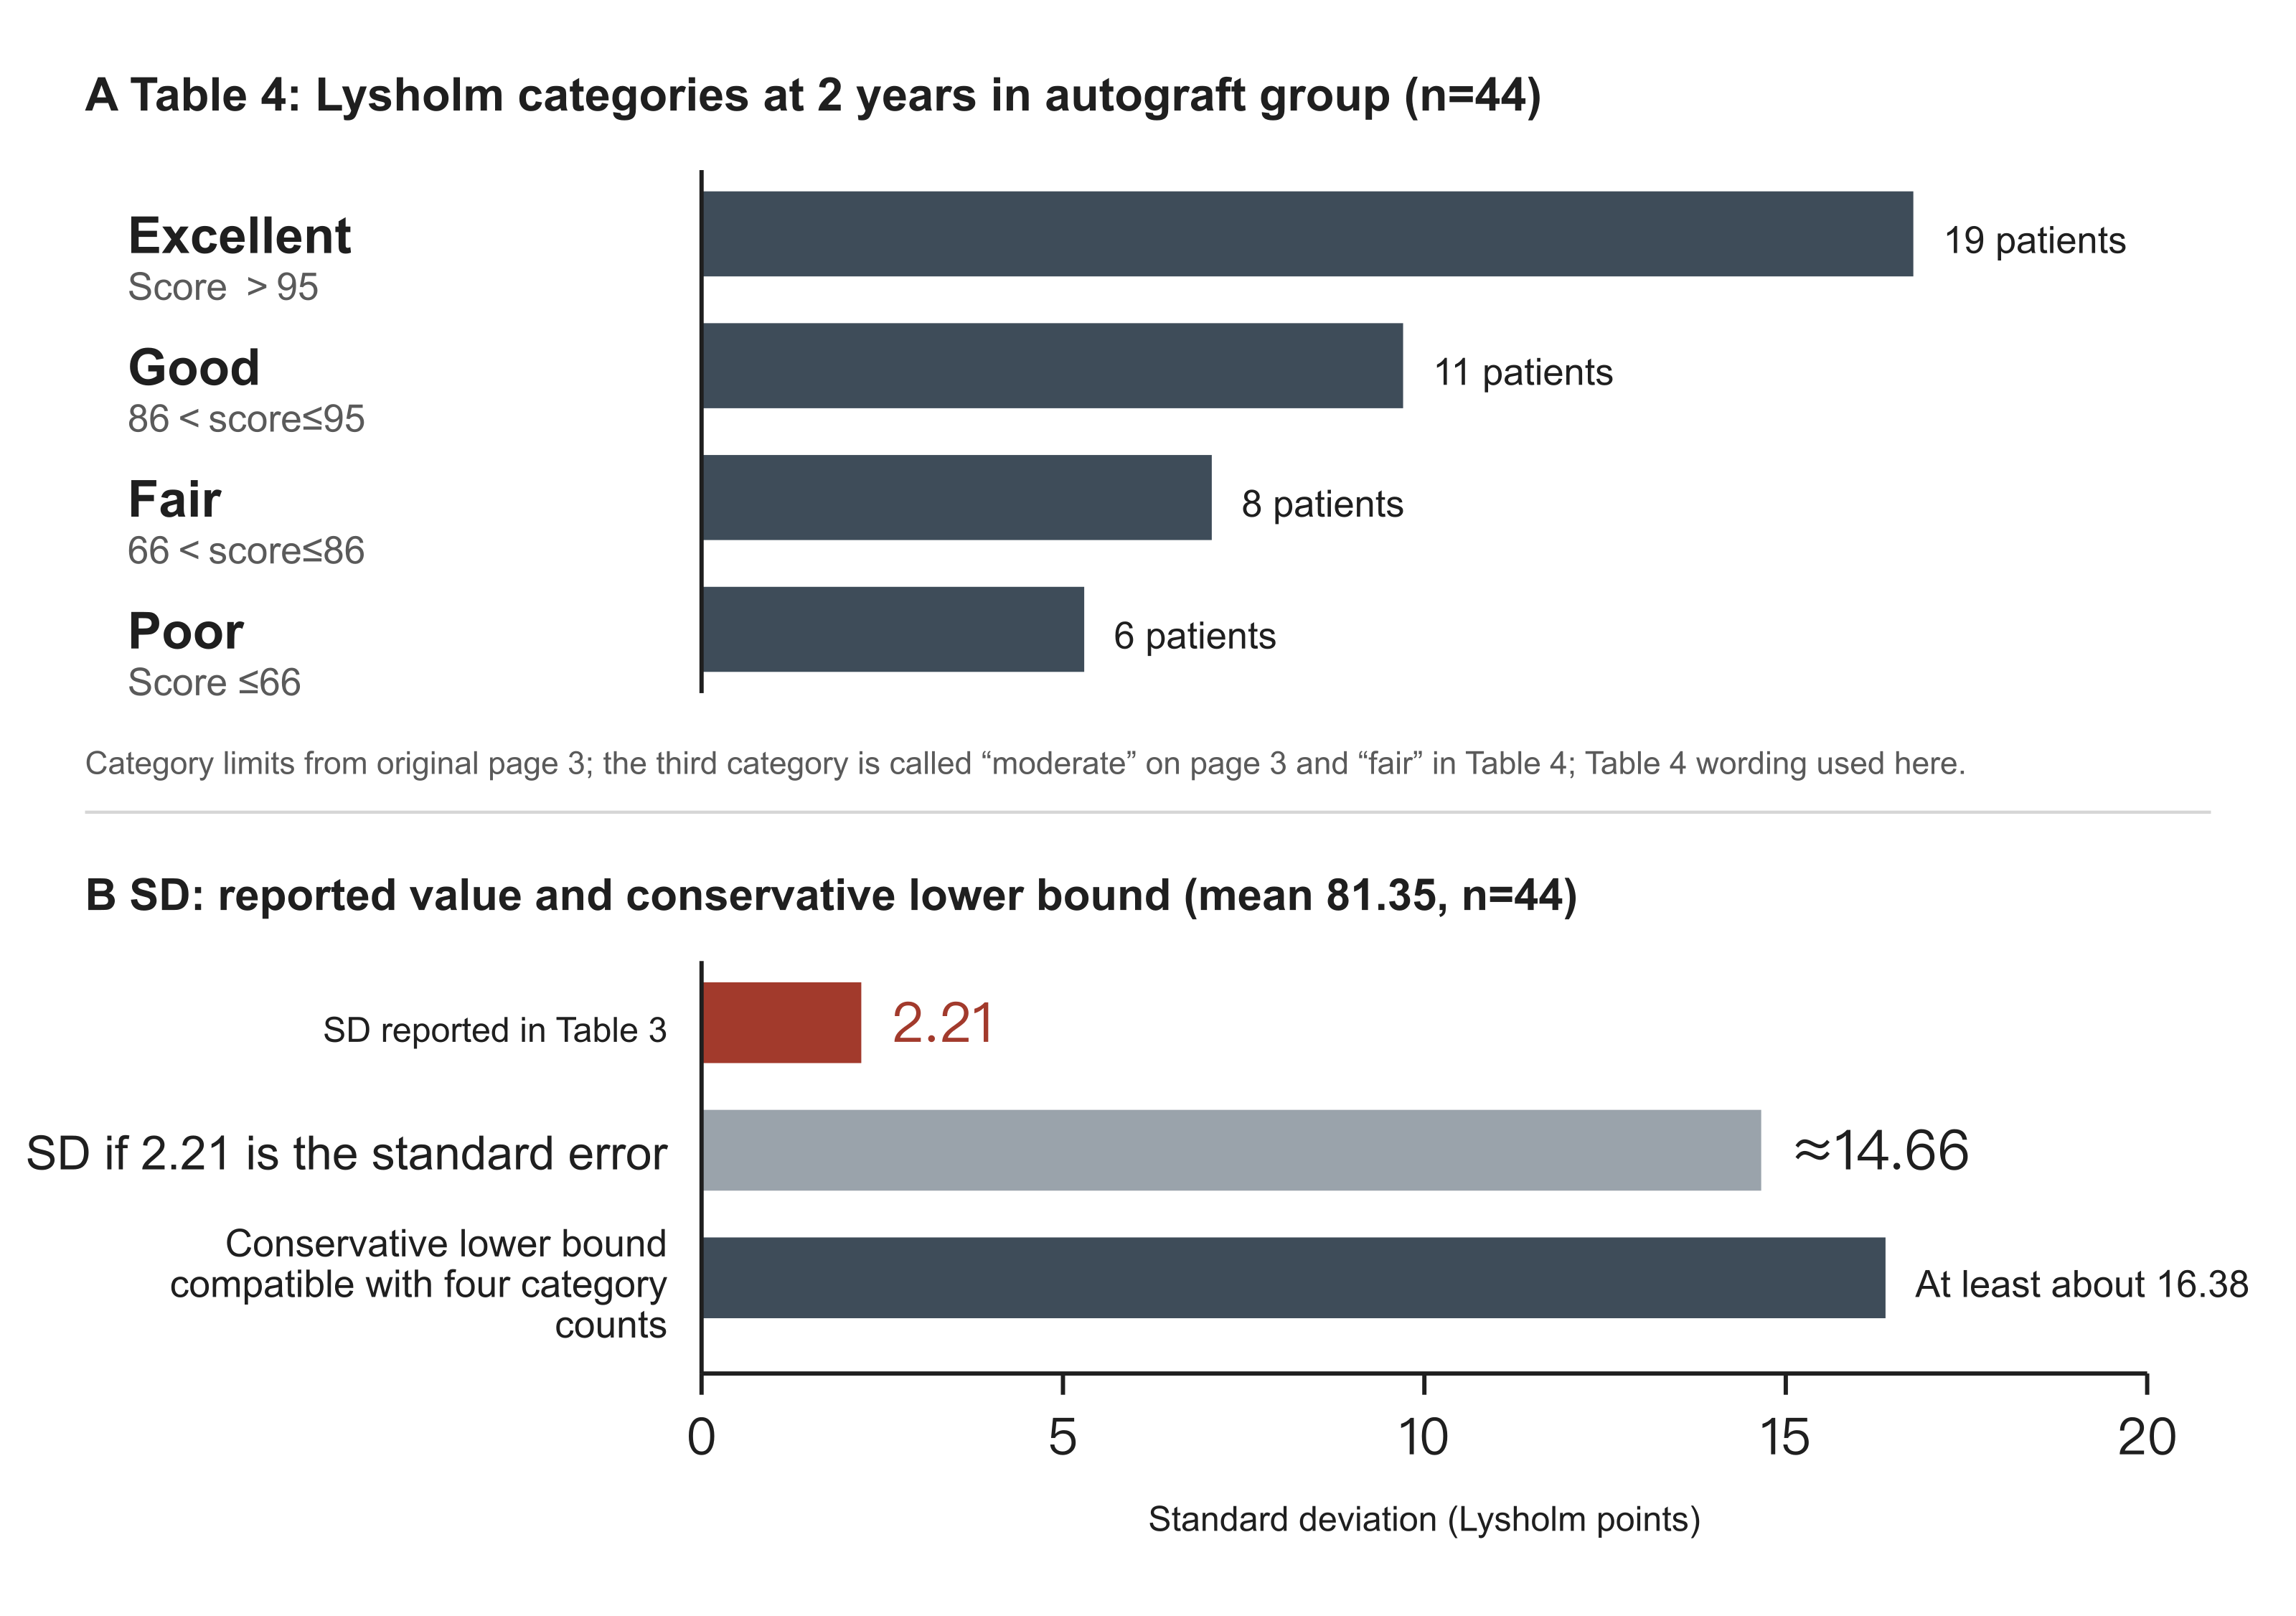
Figure 2. Zhengzhou study, autograft Lysholm at 2 years postoperatively: grade counts and standard deviation
Data from Tables 3 and 4 on page 4 of Cao et al. [R06]; grade endpoints from page 3; the third grade is called "fair" on page 3 and "acceptable" in Table 4. A shows the grade counts from Table 4 and represents only grade counts, not any individual scores. B compares three standard deviations: the 2.21 reported in Table 3; the SD of about 14.66 if 2.21 were in fact a standard error converted with n=44; and the conservative lower bound on the SD when n=44, mean 81.35, and the four grade counts hold simultaneously, obtained by relaxing the strict inequalities of each grade to equalities, with a feasible value of at least about 16.38.
Placing the two tables together already shows the contradiction (Fig. 2). Looking only at the ends: 19 people above 95 and 6 below 66; the sum of squared deviations of these 25 alone relative to the mean 81.35 requires
SD ≥ sqrt[ (6×(81.35−66)² + 19×(95−81.35)²) / 43 ] = 10.73
What is printed is 2.21, about 4.9 times smaller. Taking the four grade counts together with the mean, the lower bound is higher. To satisfy simultaneously a division of 44 people into grades of 19/11/8/6 with a mean of exactly 81.35, the configuration of least dispersion is 19 at 95, 11 at 86, 8 at 66, and the remaining 6 each at 50.07: after the first three grades are pressed to their respective lower bounds, these 6 must fall around 50 to pull the mean back to 81.35. This configuration gives
SD ≥ 16.38
If 2.21 is treated as a standard error with a mislabeled header, backing out SD=2.21×√44≈14.66 still falls below 16.38 and likewise cannot accommodate these four grade counts. The original grade definitions use strict inequalities; relaxing them to closed intervals above only lowers the bound, so 16.38 is a conservative estimate; this derivation does not depend on the scores being normally distributed.
The F values also do not match. The Methods of that paper explicitly write one-way ANOVA [R06]; recalculating from the printed means and SDs in the tables yields F≈414.7 for the 2-year postoperative row (original 7.353), F≈340.0 at 0.5 years (original 6.121), and F≈0.04 preoperatively (original 1.512); if reinterpreted as standard errors, the preoperative row becomes F≈0.001, even farther from 1.512. Working backward to the within-group dispersion needed to obtain the printed F values:
| Table and time point | Pooled SD from printed data | Pooled SD needed to match printed F | Direction |
|---|---|---|---|
| Table 3 preoperative Lysholm | 3.52 | 0.57 | Needs to be about one-sixth |
| Table 3 0.5-year Lysholm | 2.77 | 20.65 | Needs about 7.5-fold larger |
| Table 3 2-year Lysholm | 2.15 | 16.12 | Needs about 7.5-fold larger |
| Table 5 2-year IKDC | 4.06 | 15.22 | Needs about 3.7-fold larger |
| Table 6 0.5-year KT-1000 | 1.65 | 1.86 | Needs about 1.1-fold larger |
| Table 9 2-year HSS | 4.11 | 16.83 | Needs about 4.1-fold larger |
| Table 11 time to return to sport | 0.85 | 4.92 | Needs about 5.8-fold larger |
The directions of the needed adjustments are not consistent: the preoperative row needs dispersion about one-sixth as large; the remaining rows need it 1.1 to 7.5 times larger. A single mislabeled unit, a single confusion of SD with SE, or a single slip of the pen cannot explain these differences at once. In all seven recalculated rows the printed F cannot be reproduced from the printed headcounts, means, and SDs of the same row. One place would change the judgment: Table 6 KT-1000 at 0.5 years postoperatively prints F=2.654, P=0.103 (nonsignificant); recalculation from the table figures gives F=3.376, P=0.037 (significant) [R06]. This recalculation assumes that what is printed is the SD, but under either reading the printed test statistic does not match.
The composite group's Lysholm at 2 years postoperatively was 94.52, and time to return to sport was 2.81±0.53 months (autograft 6.59±1.02, artificial 4.22±0.91) [R06]; these two figures are printed in Table 3 on page 4 and Table 11 on page 6, and both tables fall within the problems above: the Table 11 row recalculates to F≈224.1, whereas the original prints 6.628. They can only be quoted as numbers reported by that study, not as quantitative evidence of between-group superiority, and cannot count as independently replicated early benefit.
These calculations test only whether published summary figures are mutually compatible; they cannot prove fabrication, nor can they prove that composite grafts are ineffective; they show that the means, dispersion values, grade counts, and test statistics in this report contradict one another, and that until the authors or the journal clarify, its efficacy figures do not meet the conditions for citation or pooling. What can still be used are design and descriptive facts: First Affiliated Hospital of Zhengzhou University, January 2016 to January 2019; 132 patients divided into three groups by the graft they voluntarily chose after being informed of the pros and cons of different grafts—preference assignment, not randomization; 2-year follow-up; athletes explicitly excluded, so conclusions do not apply to competitive populations; authors declare no conflicts of interest, and the full text has no funding entry [R06].
Kuwait study: KT-1000 grade counts are incompatible with the mean and SD. The retrospective comparison by Hamido et al. [R38] (27 composite, 45 autograft, grouped by tendon condition, mean follow-up 5 years) belongs to the parallel suture-augmentation configuration (Fig. 1C) and is also included in the meta-analysis below. Table 2 on page 3 lists KT-1000 side-to-side difference at 5 years by interval: of 27 in the LARS group, 24 <3 mm and 3 in 3–5 mm, mean 1.1±0.3 mm; of 45 in the autograft group, 32 <3 mm, 9 in 3–5 mm, and 4 in 6–10 mm, mean 2.5±0.5 mm [R38]. The autograft row itself cannot hold: with mean 2.5 and SD 0.5, 6 mm is 7 SDs above the mean, yet 4 people in that group fall in the 6–10 mm interval. Back-calculating from the listed category counts, the mathematical lower bounds on the two groups' SDs are about 0.685 mm and 1.187 mm, both larger than the printed 0.3 and 0.5 [R38]. The same page has two further disagreements: the mean-column P in Table 2 is 0.027, yet the body writes the same mean comparison as P=0.013; the body writes 24/27 as 92%, actually 88.9% [R38]. This study can show that the configuration of short or thin hamstring plus LARS has clinical application; its stability figures cannot be adopted for now.
Meta-analysis by Antzoulas et al.: Forest Plots Disagree with the Body
This systematic review and meta-analysis [R35] (PROSPERO CRD42024536835; search to 4 September 2024; PubMed and Scopus only) included 6 studies and concludes that composite grafts have an early functional advantage and are equivalent to pure hamstring autograft in the long term. Its forest plots disagree with the body in multiple places, three of which change the judgment of statistical significance; the sign of the point estimates does not change.
| Outcome | Body and figure legend | Actual forest plot |
|---|---|---|
| 12-month Lysholm | SMD 0.83 (0.64–1.01), P<0.001, I²=0% | 0.63 (−0.64 to 1.90), I²=91.3% |
| 12-month IKDC | 0.50 (0.35–1.36), P<0.001, I²=42% | 0.50 (−0.35 to 1.36), I²=80.9% |
| Long-term Tegner | 0.32 (0.06–0.71), P=0.04, called significant | 0.32 (−0.06 to 0.71), I²=63.7% |
| Long-term Lysholm | Body 0.19 (−0.21 to 0.58), agrees with figure | 0.19 (−0.21 to 0.58); legend printed as 0.22–0.58 |
| 12-month Tegner | 0.72 (0.11–1.32), I²=33% | 0.72 (0.11–1.32), I²=46.9% |
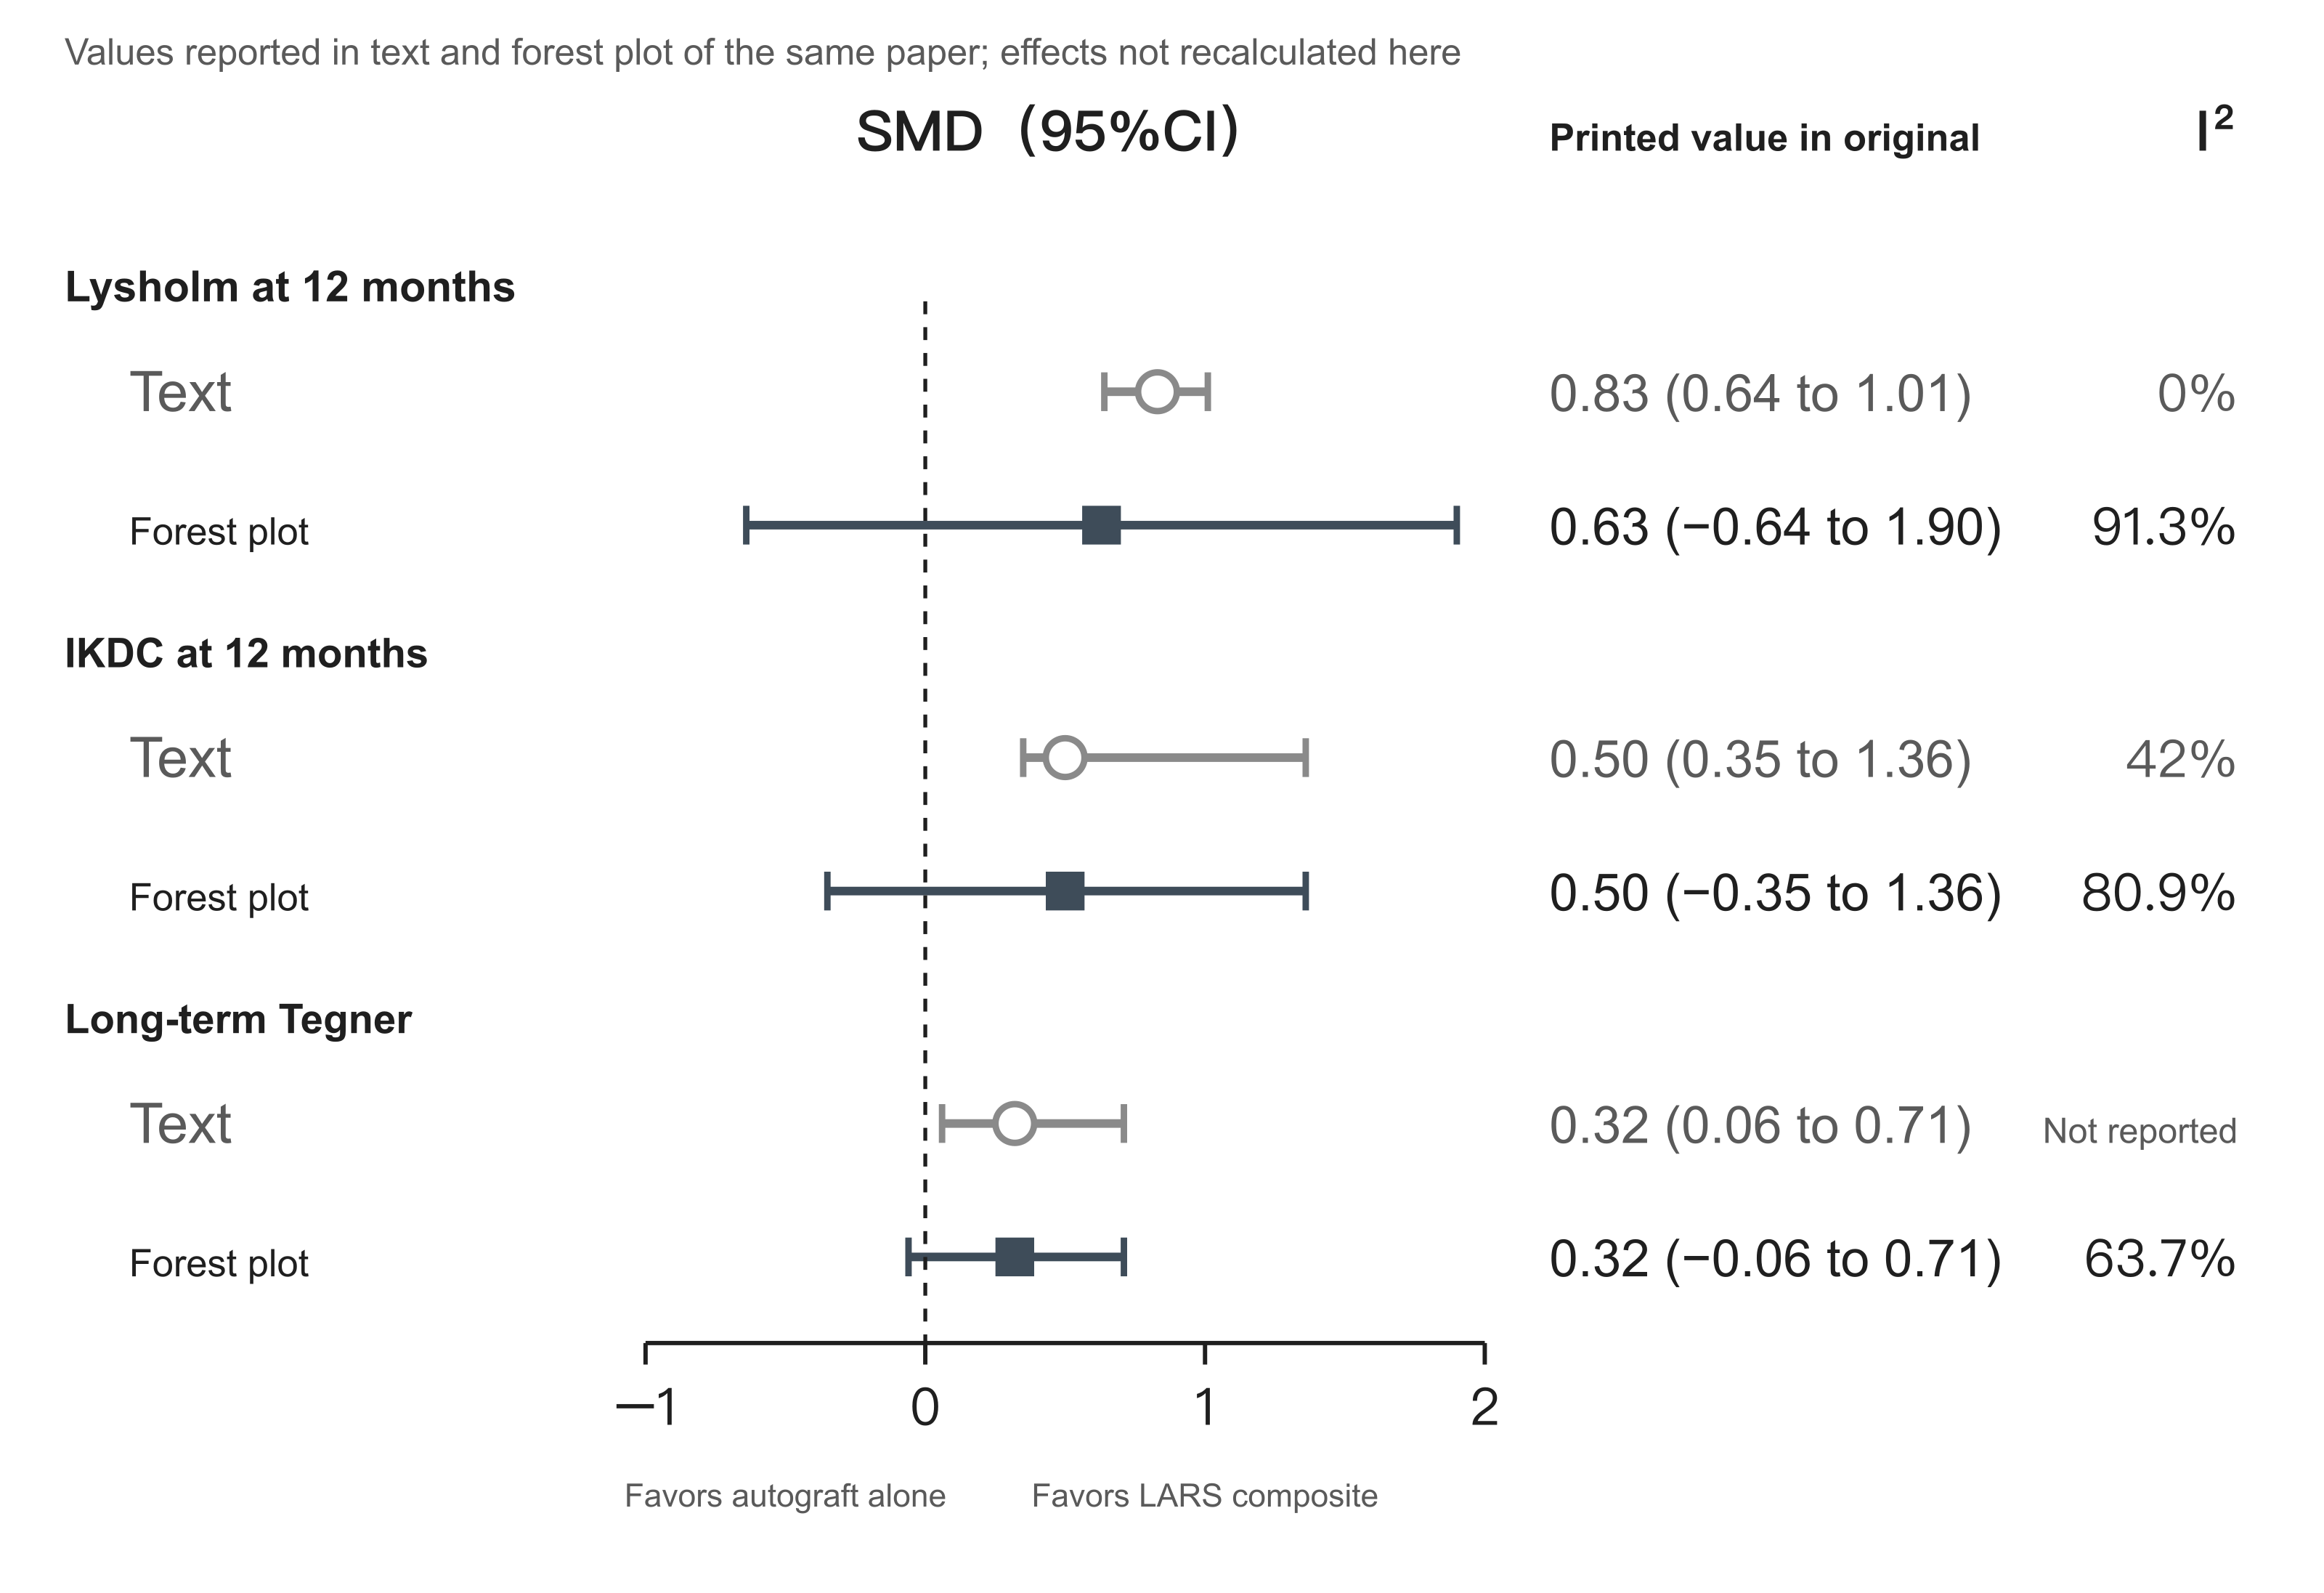
Figure 3. Antzoulas et al. meta-analysis, three outcomes: values reported in the body versus pooled values on the forest plots
Data from the body on pages 5–7 and from Figs. 3, 5, and 10 of Antzoulas et al. [R35], all printed report values from the original, not recalculated pooled effects. For each outcome the upper row is the standardized mean difference and 95% CI reported in the body; the lower row is the pooled value printed on the corresponding forest plot; the vertical dashed line is 0. For 12-month IKDC and long-term Tegner the lower bound of the confidence interval given in the body is positive, whereas on the forest plot it is negative; for 12-month Lysholm both the point estimate and the confidence interval differ between the two. By the forest plots, all three confidence intervals cross 0; by the body, none does. On the right are the heterogeneity I² values given separately by the body and the forest plots; the body does not report I² for long-term Tegner.
The first three rows determine the paper's conclusions. The forest-plot pool for 12-month Lysholm crosses 0, and the point estimate is not 0.83 either; for 12-month IKDC and long-term Tegner the body's lower bound is positive and the forest plot's is negative, so two results that cross 0 on the forest plots are written in the body as not crossing 0 and labeled significant (Fig. 3 of this chapter). Heterogeneity reported in the body is in every case lower than on the forest plots: original Fig. 3 (12-month Lysholm) 91.3%, body 0%; Fig. 5 (12-month IKDC) 80.9%, body 42%; Fig. 8 (12-month Tegner) 46.9%, body 33%; Fig. 10 (long-term Tegner) 63.7% and Fig. 4 (long-term Lysholm) 62.1% are not reported in the body [R35]. Which of figure and text is correct is not stated in the original; until the authors or the journal clarify, this paper cannot be used to confirm an early functional advantage of composite grafts.
Total headcounts also do not match: the Abstract writes 764 cases; the group counts of the six studies in Table 1 sum to 744 (178, 136, 94, 196, 68, 72); the headcounts in Table 4 on page 9 and Table 5 on page 10 likewise sum to 744 [R35]. The study-to-row correspondence in Table 3 on page 8 has at least one misplacement: the row labeled [37] back-calculates from the given percentage to a denominator of 89, yet [37] is the study with 47 per group; the row labeled [38] back-calculates to 47, yet [38] is the study with 89 per group [R35]; this complications summary table should not be used directly.
Labeling of study design is also unclear. Table 1 marks both prospective studies as "prospective (Level II)"; no row in the whole table is marked Level I or randomized controlled trial, yet the body on the same page says that "one Level I prospective nonblinded clinical trial" was included, and the Methods also say that one was assessed with the RoB2 tool as a randomized controlled trial [R35]. The reader cannot tell from Table 1 which is the randomized trial and can only work backward from the quality-assessment table on page 5: that table rates five cohort studies with the Newcastle–Ottawa scale, and the missing one is precisely the [37] treated as a randomized trial. Page 4 of the body says sample sizes ranged from 59 to 196, whereas the smallest sum of the two arms among the six studies in Table 1 is 68 and the smallest single arm is 27; "59" appears nowhere else in the full text and its source is unknown. Page 11 says complication data are in Table 2; they are actually in Table 3, and Table 2 is the quality assessment [R35].
The Abstract conclusions state that composite grafts "may benefit older patients or those with higher body mass index." "May benefit" and "awaits further study" in the Discussion are not logically mutually exclusive; the problem is that the full text performs no subgroup analysis by age or body mass index whatever, reports no body mass index from any included study, and has mean ages in the included populations between 20 and 33 years, with no elderly cohort to begin with. This is a speculation without data support placed in the Abstract conclusions. The Abstract's "secure graft stability" also does not mean more stable than the control: page 7 of that paper explicitly writes that this outcome was not pooled because of large heterogeneity in how KT-1000 was reported [R35]; "stable" is only a narrative summary. The KT-1000 narrative also relays the two means, P=0.013, and 92% from the Kuwait study [R35], and the source problems are thereby transmitted. The paper declares no funding and no conflicts of interest [R35].
Existing Evidence on Composite Grafts
Amount of tendon harvest. All published autograft-plus-artificial configurations still require harvesting autologous tendon [R06][R31][R30][R36][R38][R37]. Whether less can be taken depends on the configuration: [R06][R31][R30][R38] all took two tendons; [R36] uses a single strand braided with an internal-brace ligament and then folded, and the authors state that the filling effect of the internal artificial component makes reaching 8 mm diameter with less harvest possible; [R37] harvests only gracilis. Saying generically that "composite grafts allow less tendon harvest" ignores configuration.
Histologic fate of the artificial component. PET is a nonabsorbable synthetic material and after implantation does not undergo the "necrosis–vascularization–remodeling" process of tissue regeneration [R02]. What was seen in the rabbit experiment was fibrous connective tissue enveloping the artificial fibers with gradual infiltration [R36]; what was seen in one failed human explant was sparse, disordered collagen scar tissue infiltrating between the fibers, with a thick peripheral fibrous scar band and multinucleated cells [R42]. There is no evidence to support removing the artificial portion as a routine step; among the 15 confirmed failures in the Australian pure-LARS cohort, 3 underwent arthroscopic removal of the LARS without ACL reconstruction [R41]—that is management after failure. On long-term aging, the Chinese expert consensus states that it is "not yet clear and warrants attention" [R03]. The structure of autologous tendon likewise does not return to the state of an intact ACL; collagen alignment did not normalize within an observation period of up to 117 months [R04].
Long-term data. The longest follow-up is in the two Australian studies: the 8-to-11-year study (102 cases, retrospective case–control, long-term outcomes resting mainly on a single telephone follow-up) and the study with at least 7 years of follow-up (original cohort 211, final clinical assessment 136, MRI 112) [R34][R33], both nonrandomized, single-surgeon, and single-center. The later Xiamen study reports follow-up to 3–8 years, but its failure figures and patient flow have the problems above [R30]. No randomized controlled trial of autograft-plus-artificial composite grafts has yet reported failure outcomes at 10 years or later.
Early benefit. The Shandong study at 1–6 months [R36], the two Xiamen studies at 3–12 months [R31][R30], and the Australian two-year cohort at 1 year [R32] reported higher functional scores or earlier return to activity; the two Xiamen studies are from the same hospital and team with overlapping enrollment periods and cannot be treated as two mutually independent replications. A substantial share of the specific figures supporting this direction cannot withstand checking: the test statistics of the Zhengzhou study cannot be reproduced from its own tables [R06]; the activity-return P values of the earlier Xiamen study cannot be reproduced from its own headcounts [R31]; the patient flow of the later Xiamen study does not add up [R30]; the forest plots of the Antzoulas et al. meta-analysis conflict with the body [R35]; and the mean and SD of KT-1000 in the Kuwait study are incompatible with its grade counts [R38]. Multiple studies still point to higher early functional scores; the magnitude of that advantage cannot at present be reliably estimated.
Long-term outcomes. No long-term advantage has been observed. The study with at least 7 years of follow-up found no difference, with ipsilateral reinjury numerically slightly higher in the composite group [R33]; the 8-to-11-year study found a nonsignificant difference in revision rate [R34]; in the two-year cohort the between-group differences in Tegner and return to sport were no longer detected at 2 years, and at 2 years the KOOS Activities of Daily Living subscale was higher in the autograft group [R32]; the later Xiamen study detected no difference from 18 months onward [R30]. The authors of the study with at least 7 years of follow-up state explicitly that the results do not support routinely adding synthetic augmentation for long-term benefit, on the grounds of lack of further benefit and increased cost [R33].
Cost. The Zhengzhou study writes in its conclusions that hybrid ligaments "still have the practical problems of needing to harvest autologous tendon and of rather high medical cost" [R06]; the Romanian technical paper lists increased cost as the first shortcoming [R37]; the study with at least 7 years of follow-up lists cost as one of the reasons not to support routine use [R33]. The Shandong study notes that in its region the related costs are generally covered by medical insurance [R36], which is local information.
7. Four Meanings of "Augmentation"
"Augmentation" in an operative note or preoperative discussion may mean any of the following; what they retain, what they add, and which deficiency they address are entirely different.
| Type | What is done | Problem addressed |
|---|---|---|
| Selective-bundle reconstruction / remnant preservation | Retain a still-functional native bundle or remnant | Preserve proprioception and blood supply; improve healing and synovial coverage |
| Suture-tape augmentation | Add a high-strength suture tape beside the graft | Protect the graft from irreversible elongation during maturation |
| Artificial material combined with autologous tendon | See Section 6 | Immediate mechanical support plus autologous biology |
| Lateral extra-articular augmentation | Iliotibial band tenodesis (LET) or anterolateral ligament (ALL) reconstruction | Control rotational laxity; reduce graft failure in high-risk populations |
Selective-Bundle Reconstruction and Remnant Preservation
A French multicenter prospective randomized study [R15] enrolled 54 partial tears; 29 underwent selective AM-bundle reconstruction with PL remnant preserved and 25 standard anatomic single-bundle reconstruction, with 1-year follow-up. Subjective IKDC (86.2 versus 85.7) and Lysholm (90.9 versus 91.8) did not differ; the side-to-side difference in anterior laxity measured by Rolimeter was 1.2 mm versus 1.9 mm (P=0.03). The 0.7 mm difference is statistically significant, but the sample is small, follow-up only 1 year, and only a specific type of partial injury was studied; it cannot prove fewer long-term failures.
The meta-analysis by Yeo et al. [R14] (11 studies, 1107 patients, pooled mean follow-up 29.5 months, Level of Evidence IV, comparative data predominantly nonrandomized) showed a lower instrumented side-to-side difference in the selective-bundle reconstruction group (P<0.01), with no difference detected in the remaining postoperative outcomes. The authors phrase the result as "stability and function provided by preserving an intact bundle are as good as complete reconstruction." Failure to detect a difference is not proof of equivalence; a more accurate statement is that in this body of predominantly nonrandomized evidence most outcomes showed no difference. The premise of this result is that the retained bundle is indeed still functional; it does not apply to complete rupture or to cases with only tissue remnant.
The 2025 meta-analysis by Liu et al. [R16] (36 papers, search to 25 April 2025) divides remnant preservation into three types: selective-bundle augmentation, tibial remnant tensioning, and remnant sparing. Pooled results were: better Lachman in the preservation group (OR 1.61, 95% CI 1.25–2.08), better pivot shift (OR 1.34, 95% CI 1.03–1.75), better synovial coverage (OR 2.00), and fewer failures (OR 0.48, 95% CI 0.30–0.77, P=0.002); on functional scores Lysholm (WMD 1.52), Tegner (WMD 0.40), and IKDC subjective score (WMD 1.00) all reached statistical significance.
The Abstract and body of that paper write the pooled Lachman and pivot-shift values as WMD, whereas the headers of Figs. 3 and 5 are both "Odds Ratio 95% CI" and the legends also state an odds-ratio model; 1.61 and 1.34 are both ORs [R16]. This is a labeling error in the text; computing an OR after dichotomizing graded examinations at a specified grade is legitimate practice and is not a misuse of statistical method.
The main problem is classification. Supplementary Appendix S3A defines selective-bundle augmentation to include "obtaining an augmented graft by adding synthetic material or increasing the number of tendon folds," and Appendix S3B accordingly places in the augmentation group: the Huashan Hospital 10-year cohort of pure LARS AC120 versus hamstring tendon (Chen 2017, n=89) [R39], the two Xiamen studies of hamstring plus LARS versus hamstring alone (Zaid 2022, n=158; Zaid 2023, n=77) [R31][R30], Adachi 2000 connecting the ends of the semitendinosus with a Leeds-Keio artificial ligament, and Müller 2023 of ACL suture repair plus InternalBrace suture tape [R16]. These studies may all have preserved a remnant, but what they compare at the same time is graft material, and Müller 2023 compares repair rather than reconstruction. Their entry into the augmentation subgroup follows the authors' definition and is not a misplacement, yet the consequence is the same: the pooled value of that subgroup cannot represent the effect of remnant preservation itself.
In the failure-rate figure, the pooled OR of the augmentation subgroup is 0.39 (0.21–0.75), the only one of the three subgroups in which a difference was detected; the tension subgroup 0.70 (0.17–2.86), the sparing subgroup 0.57 (0.27–1.20) [R16]. Of the 5 studies in that subgroup, 3 (Chen 2017, Zaid 2022, Zaid 2023) compare artificial materials. Another, vanKeulen 2022, is a nonrandomized comparison of retaining versus not retaining continuous residual tissue in pure autologous semitendinosus reconstruction (listed as Level III in the appendix), with failures 2/47 versus 14/35, OR 0.07 (0.01–0.32)—itself clearly favoring preservation and also clearly departing from the remaining items [R16].
In Supplementary Appendix S10C, after "excluding grafts other than hamstring autograft," the pooled result from 7 studies was OR 0.42 (0.24–0.75), the augmentation subgroup 0.26 (0.11–0.61), with vanKeulen 2022 weighted at 38.7% [R16]. This analysis still retains Zaid 2022 of hamstring plus LARS, and Moutzouros 2024 listed in Appendix S2B as bone–patellar tendon–bone autograft, which does not match its title and cannot be treated as a pure remnant-preservation comparison that has already excluded artificial materials; how large a share artificial-material comparisons take in the overall pool is not separated by the existing sensitivity analyses. Appendix S10A, restricted to randomized trials, leaves only two studies (Zaid 2023 and Annear 2019, 119 patients in total), pooled OR 0.67 (0.26–1.72), with no difference detected, and the one weighted at 75.8% is still a LARS study [R16].
The association of remnant preservation with lower failure rate therefore comes mainly from nonrandomized evidence and depends to a substantial degree on the single study vanKeulen 2022; randomized evidence is at present insufficient to confirm this association.
Functional scores are a separate class of problem. The minimal clinically important differences adopted in that paper are Lysholm 8.9 points, Tegner 1 point, and IKDC subjective score 16.7 points; the pooled differences of 1.52, 0.40, and 1.00 points are all far below these thresholds, and the authors also state that only one included study reported a Lysholm improvement reaching that threshold, with neither IKDC nor Tegner change exceeding it [R16]. These thresholds address change in score; a between-group mean difference smaller than the threshold shows that the average difference is small and does not mean that every patient feels no difference. The paper's conclusions state that improvement in functional recovery "did not reach a significant level," set alongside P<0.05 for each score in the Results; read with its MCID statement, what is meant should be clinical importance rather than statistical significance, and the original wording is easily confused. The network meta-analysis grouped by remnant length as a percentage of the original ACL: the side-to-side difference at about 75% remnant was 0.27 mm lower than at 0% (MD −0.27, 95% CI −0.51 to −0.03)—an instrumented measurement to which the functional-scale thresholds above do not apply; Lysholm improved most when the remnant was longer than 75%, and Tegner was more favorable above 67%; the Abstract generically calls 75% optimal [R16]. These are statistical subgroup comparisons based on a small number of studies, not remnant-length targets to be reached at surgery.
Suture-Tape Augmentation
Suture-tape augmentation (common product Arthrex FiberTape; procedure name InternalBrace) is not the same thing as artificial-ligament internal bracing (such as the LARS internal brace ligament used in the Shandong study [R36]): the former is a high-strength suture tape added beside the graft; the latter is a PET artificial-ligament product. Interpreting a study as suture-tape research merely because "internal brace" appears in the title or procedure name will lead to wrong conclusions.
At the bench level there is a full-construct study [R28]: using porcine tibia and bovine flexor tendon, 8 constructs per group, independent suture-tape augmentation reduced dynamic elongation of small-diameter grafts after cyclic loading at 250 N and 400 N by 38% and 50% respectively (P<.001), and of standard-diameter grafts by 15% (P=.066) and 26% (P<.001); ultimate failure loads of the augmented small- and standard-diameter constructs were 1592±105 N and 1585±265 N, 64% and 40% higher than their respective controls. The authors wrote a conditional sentence: if the in vitro results can be generalized to the human in vivo situation, the technique may reduce the risk of graft tearing [R28]. Two authors of that paper are employees of Arthrex, and another receives consulting fees, travel support, and royalties from Arthrex; the authors' institution and corresponding address are the Arthrex Research and Development department (Munich), with additional university authors [R28]; FiberTape is an Arthrex product. These relationships are established and show only that industry researchers participated; the body does not state where all the experiments were completed; nor can one infer from the employment relationships of one paper that most evidence in this field is produced by manufacturers. Commercial participation is not the same as problematic data; what is needed is independent replication.
The scoping review by Mackenzie et al. [R24] (22 studies, of which 6 biomechanical, 3 animal, 10 technical, and only 3 clinical; search to 2021-11-24; authors declare no conflicts of interest) reports: after augmentation, failure load of the graft complex increased by 12.2% to 73.0% and elongation decreased by 17.0% to 60.2%; load sharing began at about 200 N for 7 mm grafts and about 300 N for 9 mm grafts, and at 400 N the suture tape carried 31% and 20% respectively. The review's conclusion on the clinical portion is that patient-reported outcomes range between improved and unchanged, and that statistical power for the graft-failure outcome is insufficient [R24]. Only 3 of the 22 are clinical studies, reflecting the research stage at that time.
Clinical evidence has changed since then. The 2022 clinical systematic review by Zheng et al. [R25] (9 studies, 314 receiving augmentation in total, mean follow-up about 16.7 months): at a minimum 2-year follow-up, 59/80 (73.8%) returned to preinjury sport level; graft failure within 2 years postoperatively was 6/266 (2.3%). Denominators differ by outcome; 314 is the number who received augmentation. The authors' conclusion is that, compared with reconstruction alone, suture-tape augmentation showed no advantage on most functional scores, stability indices, or graft failure rate [R25]. The paper also proposes that suture-tape tension should equal or be slightly less than graft tension to avoid stress shielding—an operating suggestion by the review authors, not an optimal tension proved by randomized comparison.
The 2023 prospectively enrolled case series by Wilson et al. [R27]: 97 primary reconstructions (52 hamstring, 45 patellar tendon), mean age 34.7±13.4 years, excluding multiligament injury and those with concomitant lateral augmentation; 90 could be contacted, and at a mean of about 5 years of follow-up there was 1 retear (1.1%). The study had no concurrent control group; failure was judged by imaging or revision after clinical suspicion, not by uniform imaging screening of the whole cohort. Its conflict statement states that one author receives consulting fees and royalties from Arthrex and discloses patent interests related to the internal-brace technique used in the study (listed number is an application publication number; the inventor of the technique is that author, with Arthrex as assignee) [R27]; the accurate statement is that this author disclosed related patent interests and is the inventor of the technique, not simply that he personally owns the patent. Comparison with historical literature cannot be read as proof of reduced retear; a population with mean age 34.7 years also cannot be compared directly with the high-risk 14-to-25-year population of the STABILITY trial below.
The 2026 meta-analysis by Conde et al. [R26] provides a new association signal whose scope of application is narrower than the Abstract's wording. The paper included 11 reports and 1179 patients, of which 10 are retrospective studies and only 1 a randomized trial [R26]. Failure comparison in the hamstring-plus-FiberTape subgroup: nonaugmented 17/200 (8.50%), augmented 5/163 (3.07%), totaling 363 patients and 22 failure events, OR 2.86 (95% CI 1.03–7.90), P=.043, I²=0% [R26]. The direction of this OR is nonaugmented versus augmented and can be verified from the figures in each row of the plot; writing the augmented group first without noting the direction invites reading it backward. The 3.1% and 8.5% are crude pooled proportions of that subgroup, not results for the 1179.
Materials cannot be ranked on this basis. The hamstring-plus-FiberWire subgroup had OR 0.92 (0.27–3.15), nonsignificant; the test of differences among the six subgroups on the same figure was χ²=4.12, df=5, P=.532 [R26]. Significance in one subgroup and nonsignificance in another does not mean the two materials differ in effect, and the subgroup-difference test on that figure also does not support a difference. What can be said is that a failure difference has so far been detected only in the single subgroup of hamstring plus FiberTape.
The figures for return to preinjury activity level also require limits on how broadly they are applied. The Abstract writes them as the result "after pooling all graft and augmentation-material combinations" (72.5% versus 54.0%); in fact there are only two studies (Bodendorfer 2019 and Kitchen 2022, both using FiberTape): augmented 50/69 (72.46%), nonaugmented 34/63 (53.97%), OR 0.44 (0.21–0.91), P=.027 [R26]; as with the failure figure, this OR is calculated with the nonaugmented group on the numerator side, and a value less than 1 means more in the augmented group returned to preinjury level. This result comes from only two studies and cannot be extended to other grafts or augmentation materials.
The paper itself has several further inconsistencies. Fig. 7 on page 11 gives IKDC for the hamstring-plus-FiberTape subgroup as MD −1.20 (−3.06 to 0.66); the Abstract and page 7 text write the upper bound as 0.06; Table 3 on page 13 then prints the interval as "3.06–0.66" and copies the same group's MD and interval unchanged onto the Lysholm row, whereas Fig. 8 on page 12 actually has Lysholm MD −0.96 (−4.53 to 2.61) [R26].
Table 3 on page 13 rates overall failure (OR 2.01, 1.02–3.94) as high certainty, with risk of bias and imprecision both marked as no serious limitation, yet the included studies are predominantly retrospective and overall failure events are only 13/529 versus 33/581, 46 in total [R26]. The 1110 here is 69 fewer than the full text's 1179 because the paper states that the bone–patellar tendon–bone portion of Daniel 2023 overlaps with a subsequent study from the same group and takes only the more recent, larger one—a step the authors explained, not an omission; but the Discussion and Conclusions still summarize failure results as "11 studies, 1179 cases," and that the pooled analysis is actually 1110 can be seen only by returning to Fig. 3 and Table 3. This high-certainty rating lacks an explanation commensurate with the design and event count.
The odds ratios for arthrofibrosis and subsequent meniscal surgery given in the Abstract are taken from the hamstring-plus-FiberTape subgroup; the Abstract already limits them to that subgroup but does not state that each of these two rests on only 3 studies with very wide intervals, which means failure to demonstrate a difference, not proof of no difference.
Taken together, the older summary that "no clinical study has shown a difference" is already inaccurate; a new association signal has appeared between suture-tape augmentation and lower failure rate; but it rests on predominantly retrospective studies, 22 events, and a confidence-interval lower bound close to 1, and in 3 studies the surgeons changed practice during the study period (first without augmentation, later adopting it), so that the before-and-after cohorts are not contemporaneous and growth in surgeon experience may have been counted into the effect of augmentation [R26]. The paper's title writes "reduces failure rate," a causal statement; given observational design and residual confounding, the title is stronger than the data. On safety, page 13 writes that 4/150 in the augmented group developed synovitis versus 0/60 in the nonaugmented group and on that basis calls the material well tolerated [R26]; the event count and sample are insufficient to establish that safety is the same in both groups, this wording is too strong, and these figures also cannot prove that augmentation increased synovitis.
Lateral Extra-articular Augmentation
The STABILITY trial [R22] is a multicenter randomized controlled trial; 618 were randomized, mean age 18.9 years (14 to 25), all receiving single-bundle hamstring autograft reconstruction, randomized to addition or not of iliotibial-band lateral extra-articular tenodesis. Beyond age, enrollment required at least two of three: pivot-shift test ≥grade 2, desire to return to high-risk cutting sport, and generalized ligamentous laxity.
Primary 2-year results: clinical failure (a composite of rotational laxity or graft rupture) was 120/298 (40%) in the reconstruction-alone group and 72/291 (25%) in the lateral-tenodesis group, relative risk reduction 0.38 (95% CI 0.21–0.52), P<.0001; graft rupture 34/298 (11%) versus 11/291 (4%), relative risk reduction 0.67 (95% CI 0.36–0.83), P<.001; the authors report a number needed to treat of 14.3 [R22]. Calculating directly from the raw counts, crude rupture risks are 11.409% versus 3.780%, absolute difference 7.629 percentage points, reciprocal about 13.1, not exactly matching 14.3; the Methods of that paper state use of the Mantel–Haenszel method with allowance for surgeon effects, so the difference may come from the analytic method and cannot on that basis be judged a calculation error in the original; 14.3 is the value the authors report by their analytic method.
The 40% versus 25% is a composite outcome that includes rotational laxity and cannot be written as a 40% graft-rupture rate. The population is young, high-risk patients receiving hamstring reconstruction and does not cover all ages and all grafts; the result also does not support routinely adding lateral tenodesis for every patient.
This trial has several baseline and table problems. The Abstract writes 297 men; the two groups' men in Table 1 sum to 302 [R22]. The body's "436 (87.9%) had high-grade rotational laxity preoperatively" and "215 (42.1%) had generalized ligamentous laxity" do not use 618 as denominator (436/618=70.6%, 215/618=34.8%); the original also does not state the denominator, and the eligibility-combination counts in Table 1 cannot be reconstructed [R22]. The four eligibility-criteria rows of Table 1 sum to 308 and 303, whereas the CONSORT figure's randomized numbers are 312 and 306, short by 4 and 3 respectively, unexplained in the original. The lower age limit for enrollment is written as 14 years in the Abstract and Methods and as 15 years in the Discussion. The denominators and event counts in the forest plot of Fig. 4 on page 7 also differ from the body: panel A clinical failure is 119/299 reconstruction alone and 71/291 with lateral tenodesis, versus 120/298 and 72/291 in the body; panel B rupture is 34/299 versus 11/291, with the reconstruction-alone denominator 298 in the body. Proportions calculated from the figure numbers are about 39.8% and 24.4%, close in direction and magnitude to the body's 40% and 25%.
Table data for two secondary outcomes also contain contradictions. "At 3 months the reconstruction-alone group had less pain (P4 scale P=.003, KOOS P=.007), and the KOOS pain difference persisted to 6 months (P=.02)"; the 6-month row in Table 2 is an adjusted mean difference of 1.8, 95% CI (−0.2 to 3.5), with P marked .02 [R22]—an interval that crosses 0, inconsistent with P<.05. The row underlying "at 2 years activity levels were similar in both groups (Marx score P=.11)" has a point estimate outside its own interval (24-month MD −1.6, interval −1.4 to 0.1), and the baseline row likewise (MD 1.5, interval −0.2 to 1.4) [R22]. These errors in the secondary-outcome tables do not overturn the primary outcome, but they also do not mean that the primary counts have already been verified free of error; the figure–text denominator differences of the preceding paragraph fall on the primary outcome.
The trial was funded by an ISAKOS research award; several authors disclose royalties, consulting fees, or lecture fees from Smith & Nephew, Conmed, and other companies [R22]. The graft tissue used for LET is taken from the patient's own iliotibial band, but fixation uses a named commercial device (Richards staple with barbs, Smith & Nephew); the femoral end of the ACL reconstruction uses a cortical suspension device (Endobutton CL, Smith & Nephew; or Exobutton, Conmed) and the tibial end an interference screw [R22]. This trial does not compare a particular artificial ligament, but implanted devices are indeed present.
The SANTI trial [R23] is a single-center randomized controlled trial from Lyon, France; 593 were randomized (297 ACL+ALL reconstruction, 296 ACL reconstruction alone), ages 18 to 35 years (mean 25.0±4.5), and 556 (94%) completed a mean 5-year follow-up. Five-year graft failure was 12/283 (4.2%) versus 28/273 (10.3%), P=0.006; adjusted odds ratio 2.54 (95% CI 1.27–5.36), direction pure bone–patellar tendon–bone reconstruction relative to hamstring plus ALL; number needed to treat overall 17, under 25 years of age 9 [R23]. Checking against raw counts: 28/273 minus 12/283 is about 6.02 percentage points, reciprocal about 16.6; under 25 years 22/134 minus 7/147 about 11.66 percentage points, reciprocal about 8.6; both figures match.
The difference between the two groups is not only presence or absence of ALL reconstruction: the ACL+ALL group used hamstring autograft and the ACL-alone group bone–patellar tendon–bone autograft [R23]. The trial compares two complete plans; attributing all differences to the ALL is a misreading. The trial is single-center, outcome assessors were not blinded, there were only three surgeons, randomization was not stratified by surgeon, and the analysis did not adjust for clustering [R23]. The authors themselves state that early failures (usually fixation-related) within the first 2 years did not differ between groups and that divergence in failure rates appeared after 3 years [R23]. The accurate statement is: the trial detected a difference in failure rate only after 3 years; failure to detect a difference in the first two years does not mean there was truly no difference in those years.
Funding and authors' interests need to be described separately. The trial lists its funder as GCS Ramsay Santé pour l'Enseignement et la Recherche and states that the funder took no part in design, data collection, analysis, interpretation, or writing [R23]. At the same time several authors disclose relationships with Arthrex: one received Arthrex fellowship support, four received Arthrex consulting fees, of whom three also received Arthrex research funding, one holds AREAS equity, and one also has Newclip consulting fees; Arthrex fixation devices were used in surgery [R23]. Authors' other interest relationships do not mean this trial was funded by Arthrex, but introducing only the noncommercial research foundation without mentioning the authors' industry ties would leave readers thinking no commercial relationship exists.
The original protocol's primary endpoint was 3 years; because of the pandemic it was formally amended on 12 April 2022 to extend to 5 years; 3-year data exist but have not been published separately [R23]. When queried on 8 October 2026, the ClinicalTrials.gov (NCT03740022) record still listed the primary-outcome timing as 3 years; that record was last updated on 25 November 2024. This registration discrepancy exists but is insufficient to conclude that the authors changed the timing only after seeing favorable results. Headcounts in the paper's flow diagram and body also do not match: Fig. 2 writes 638 assessed as eligible, 630 randomized, 45 excluded, 593 receiving treatment, yet 630 minus 45 equals 585; page 5 of the body writes 638 randomized, 45 refused, 593 undergoing surgery—a chain that does add up. Inconsistency of reporting does exist and cannot on that basis be used to conclude that 8 subjects are unaccounted for.
The corresponding AAOS 2022 item is: when reconstructing with hamstring autograft, ALL reconstruction / LET may be considered in selected patients to reduce graft failure and improve short-term function; long-term outcomes remain unclear (high-quality evidence; recommendation strength downgraded one level to moderate because of possible increases in incision, implants, and anesthesia time) [R01].
Primary repair and bridge-enhanced repair are not discussed in this chapter; AAOS 2022 has a strong recommendation on this point: ACL tears with a surgical indication should undergo reconstruction rather than repair, on the grounds of lower risk of revision surgery [R01].
8. Graft Strength, Biological Remodeling, and Functional Recovery
Initial material strength, tendon–bone healing and intra-articular remodeling, and muscle strength with neuromuscular control are three different processes. The ex vivo maximum failure load of a particular model of artificial ligament listed in the consensus [R02] speaks to the first, not to the material's strength over time in the human body. After implantation, autologous tendons undergo necrosis, proliferation, and ligamentization; human biopsies show remodeling still active one to two years postoperatively, and collagen alignment within an observation period of up to 117 months still does not return to the state of an intact ACL [R04]; artificial materials do not undergo this process, and what was seen around one failed explant was fibrous scar envelopment [R42]—these belong to the second. The third is obtained through rehabilitation training and is also a major component of return-to-sport assessment [R05]. Harvest site affects muscle strength: harvesting the patellar tendon affects the extensor mechanism, harvesting hamstring tendons affects knee-flexion strength [R02], so one cannot say that material is unrelated to muscle strength. A material that is superior on the first item cannot be inferred to be superior on the latter two, still less to allow earlier return to sport; inferring "faster recovery" directly from material strength skips the latter two processes.
Return-to-sport data reported in composite-graft studies—such as 89.3% of the composite group in the Xiamen study already participating in cutting, twisting, and jumping sports at 6 months [R31], and the Zhengzhou study's hybrid group returning to sport at 2.81 months postoperatively [R06]—describe the activities recorded in the studies, not safety conclusions or recommendations on timing of return, and both figures themselves fall within the statistical problems described in Section 6. The Panther international consensus advocates abandoning purely time-based return-to-sport decisions in favor of criterion-based stepwise progression: first return to participation, then return to sport, and finally return to performance; judgment by a multidisciplinary team combining objective examination, validated functional tests, and psychological readiness, also taking biological healing, specific context, and concomitant injuries into account [R05].
Clinical Outcome Comparison Across the Main Contrasts
"No difference detected" in the table means that no statistically significant difference was detected in the corresponding studies; it does not mean that the two have been proved identical. Sources for each cell are marked within the cell.
| Outcome | Single-bundle vs double-bundle | Hamstring vs bone–patellar tendon–bone | Autograft vs allograft | Autograft vs pure artificial ligament | Autograft vs autograft + artificial composite |
|---|---|---|---|---|---|
| Symptom and function scores | Mostly no difference detected; KOOS quality-of-life subscale higher with double-bundle; authors judged it not to reach their adopted threshold of clinical importance [R10] | No difference detected [R17] | The cited MOON cohort analyzed only graft rupture and did not compare function scores [R21] | Artificial group slightly higher from 6 months to 1 year; no difference detected thereafter [R39] | Multiple studies report higher composite-group scores at 6–12 months; statistics of several cannot be verified (Section 6) |
| Stability | Pooled interventional results of R09 showed no difference detected; observational studies suggest less residual pivot shift with double-bundle; R11 reports better IKDC objective grade with double-bundle (a composite examination grade, not a single laxity value) | No difference detected [R17] | Material cited in this chapter does not report this comparison | No difference detected [R39] | That meta-analysis did not pool KT-1000 [R35] |
| Return to which sport | Reported proportion returning to preinjury sport at 2 years: no difference detected [R13] | Return to preinjury level: no difference detected [R17] | Material cited in this chapter does not report this comparison | Early Tegner higher in the artificial group [R39] | Higher in the composite group at 1 year; no longer detected at 2 years [R32]; P values of the Xiamen study cannot be verified [R31] |
| Graft rupture / revision | Directions of the two long-term cohorts disagree; neither detected a difference [R10][R11] | Less with bone–patellar tendon–bone (OR 0.59) [R17] | Allograft adjusted OR 3.97 [R21] | At 10 years 8.2% versus 7.9% [R39]; pure artificial-ligament cohorts 4.5% [R40] and 33.3% [R41]; failure criteria, examination methods, and populations all differ and cannot be compared directly | Revision for ACL failure at 8–11 years: autograft 12.5%, composite 5.7%, no difference detected [R34]; at 7 years or later no difference detected, ipsilateral reinjury numerically slightly higher in the composite group [R33] |
| Harvest-site problems | Determined by the graft used | Less anterior knee pain, kneeling pain, and extension deficit with hamstring [R17]; less harvest-site discomfort with quadriceps tendon [R18][R19]; fracture risk with a patellar bone block [R13] | No harvest injury on the allograft side; corresponding costs on the autograft side by source [R02] | No harvest injury on the artificial side; autograft side as above [R02] | Tendon still must be harvested; whether less can be taken depends on configuration [R36][R06] |
| Synovitis and other reoperations | Pooled complication results not robust [R08]; cited studies did not compare synovitis separately | Cited meta-analysis does not report a synovitis comparison [R17] | Material cited in this chapter does not report this comparison | Mild synovitis 1.6% in the domestic multicenter series [R40]; case report confirms that severe reactions have occurred [R42] | Mean MRI synovial scores identical in both groups; positive-feature proportions 35.7% versus 37.5%, no additional increase detected [R33]; another study used questionnaire items as surrogate judgment [R34] |
| Long-term osteoarthritis | No difference detected [R10][R12] | No difference detected [R17] | Material cited in this chapter does not report this comparison | Ipsilateral radiographic osteoarthritis at 10 years 55.9% versus 50.0% [R39] | WORMS at 7 years or later: no difference detected [R33] |
| Cost | Guideline resource appraisal notes that double-bundle increases operative time and cost [R01] | Material cited in this chapter does not compare cost | Additional cost [R02] | Higher cost [R02] | Adds cost of the artificial device [R37][R06]; [R33] lists cost among reasons not to support routine use |
The clinical weight of each outcome varies with the patient's age, sporting goals, occupation, and concomitant injuries.
9. Patient Factors That Affect Plan Comparison
The weight of the above comparisons in a given patient depends mainly on the following information: sporting goals, that is whether return to cutting and contact sport is intended [R22][R23]; age [R21][R22][R23]; degree of joint laxity and pivot-shift grade [R22]; concomitant meniscal and cartilage injury and how they are managed [R12][R01]; primary reconstruction versus revision [R07]; length and diameter of the patient's own tendons [R38][R36]; and the specific device, surgeon experience, and operative volume of the hospital [R03][R40].
Graft diameter is associated with failure risk [R34][R36], and the effect of age is equally clear [R21]; the failure load of artificial materials far exceeds that of the native ACL [R02], yet among the 51 failures in the domestic multicenter cohort 32 still had bony-tunnel positioning errors [R40]. "Augmentation" in preoperative discussion and the operative note should specify the concrete category: whether what is retained is a native bundle or a remnant, whether what is added is a suture tape or an artificial ligament, whether it is intra-articular or extra-articular, and whether incision and cost are increased.
References
Forty-four sources in total; search date 10 September 2026. This is not a systematic review: comprehensive searches of CNKI, Wanfang, Embase, and Web of Science were not completed; exhaustive search hit counts are not reported; and no new pooled effect estimates are generated. Guidelines, consensus statements, secondary studies, and the primary trials they include overlap; headcounts across papers cannot be added together.
- [1]
[R01] American Academy of Orthopaedic Surgeons. Management of Anterior Cruciate Ligament Injuries: Evidence-Based Clinical Practice Guideline. AAOS, 2022-08-22.
- [2]
[R02] Chen T, et al. Diagnosis and treatment of anterior cruciate ligament injuries: Consensus of Chinese experts part II: Graft selection and clinical outcome evaluation. J Orthop Translat. 2024. PMID 39257437; DOI 10.1016/j.jot.2024.07.002.
- [3]
[R03] Expert Consensus Group on New-Generation Artificial Ligaments for Anterior Cruciate Ligament Reconstruction in China. Key techniques and adverse events of new-generation artificial ligament reconstruction of the anterior cruciate ligament—a Chinese expert consensus based on a modified Delphi method (Part II). Zhongguo Xiu Fu Chong Jian Wai Ke Za Zhi. 2022;36(9). PMID 36111464; DOI 10.7507/1002-1892.202206026.
- [4]
[R04] Janssen RPA, et al. Intra-articular remodelling of hamstring tendon grafts after anterior cruciate ligament reconstruction. Knee Surg Sports Traumatol Arthrosc. 2014. PMID 23982759; DOI 10.1007/s00167-013-2634-5.
- [5]
[R05] Meredith SJ, et al. Return to Sport After Anterior Cruciate Ligament Injury: Panther Symposium ACL Injury Return to Sport Consensus Group. Orthop J Sports Med. 2020;8(6). PMID 32647735; DOI 10.1177/2325967120930829.
- [6]
[R06] Cao FY, Xu JZ, Lu ST, et al. Reconstruction of the anterior cruciate ligament with autograft and LARS artificial ligament braid: evaluation of tunnel enlargement, ligament growth factors, and knee function. Zhongguo Zu Zhi Gong Cheng Yan Jiu. 2022;26(21):3281-3290. DOI 10.12307/2022.633.
- [7]
[R07] van Eck CF, et al. The anatomic approach to primary, revision and augmentation anterior cruciate ligament reconstruction. Knee Surg Sports Traumatol Arthrosc. 2010;18(9):1154-1163. PMID 20532865; DOI 10.1007/s00167-010-1191-4.
- [8]
[R08] Xu Z, Ma L, Li R. Anatomic Double-Bundle and Single-Bundle Reconstructions Yield Similar Outcomes Following Anterior Cruciate Ligament Rupture: A Systematic Review and Meta-analysis. Arthroscopy. 2024;40(2):481-494. PMID 37230187; DOI 10.1016/j.arthro.2023.05.017.
- [9]
[R09] Murakami R, et al. Clinical outcomes of anatomical single-bundle versus double-bundle anterior cruciate ligament reconstruction: A systematic review and meta-analysis. J Orthop Sci. 2026;31(4):853-868. PMID 41571565; DOI 10.1016/j.jos.2025.12.014.
- [10]
[R10] Qadir D, et al. Long-Term Outcomes Following Anatomic Double-Bundle Versus Single-Bundle Anterior Cruciate Ligament Reconstruction Using Hamstring Autograft: A Randomized Controlled Trial With an Average 14-Year Follow-Up. Arthroscopy. 2026;42(4):788-799. PMID 41838565; DOI 10.1002/arj.70084. Same Swedish randomized cohort as Karikis 2016 and Balasingam 2022 in [R08], at different follow-up times.
- [11]
[R11] Seppänen A, et al. Double-bundle anterior cruciate ligament reconstruction resulted in better International Knee Documentation Committee objective grading at fifteen year follow-up compared to single-bundle reconstruction. Int Orthop. 2024;48(4):905-912. PMID 38337046; DOI 10.1007/s00264-024-06106-7.
- [12]
[R12] Seppänen A, et al. No difference was found between double-bundle and single-bundle anterior cruciate ligament reconstructions in terms of osteoarthritis at 15-year follow-up. Knee Surg Sports Traumatol Arthrosc. 2024;32(11):2770-2779. PMID 38819943; DOI 10.1002/ksa.12304. Same Finnish randomized cohort as [R11].
- [13]
[R13] Irrgang JJ, et al. Anatomic single vs. double-bundle ACL reconstruction: a randomized clinical trial—Part 1: clinical outcomes. Knee Surg Sports Traumatol Arthrosc. 2021;29(8):2665-2675. PMID 33970295; DOI 10.1007/s00167-021-06585-w.
- [14]
[R14] Yeo MHX, et al. Selective bundle versus complete anterior-cruciate ligament reconstruction: A systematic review and meta-analysis. J Orthop. 2022;33:124-130. PMID 35983549; DOI 10.1016/j.jor.2022.07.015.
- [15]
[R15] Pujol N, et al. Anterior cruciate ligament reconstruction in partial tear: selective anteromedial bundle reconstruction conserving the posterolateral remnant versus single-bundle anatomic ACL reconstruction: preliminary 1-year results of a prospective randomized study. Orthop Traumatol Surg Res. 2012;98(8 Suppl):S171-S177. PMID 23142049; DOI 10.1016/j.otsr.2012.09.007. Included in [R14].
- [16]
[R16] Liu X, et al. Clinical effects of different remnant-preserving versus standard nonpreserving techniques in anterior cruciate ligament reconstruction: A systematic review and meta-analysis. Knee Surg Sports Traumatol Arthrosc. 2025. PMID 41190954; DOI 10.1002/ksa.70177. Supplementary Appendix S3 lists definitions of the three types of remnant preservation and the classification of each study; Appendix S10 is the sensitivity analysis; its augmentation subgroup includes [R39][R31][R30], see Section 7.
- [17]
[R17] Zhao L, et al. Outcome of bone-patellar tendon-bone vs hamstring tendon autograft for anterior cruciate ligament reconstruction: A meta-analysis of randomized controlled trials with a 5-year minimum follow-up. Medicine (Baltimore). 2020;99(48):e23476. PMID 33235137; DOI 10.1097/MD.0000000000023476. Official erratum PMID 36044668 (2022-08-26) corrects only the duplicated printing of Figs. 7 and 15 and does not address the Tegner statistic name or the Lachman interval problem.
- [18]
[R18] White T, et al. Quadriceps, hamstring and patella tendon autografts for primary anterior cruciate ligament reconstruction demonstrate similar clinical outcomes, including graft failure, joint laxity and complications: A systematic review with meta-analysis of randomised controlled trials. Knee Surg Sports Traumatol Arthrosc. 2026;34(5):1631-1646. PMID 40679231; DOI 10.1002/ksa.12755.
- [19]
[R19] Raj S, et al. Quadriceps tendon versus hamstring tendon graft for primary anterior cruciate ligament reconstruction: A systematic review and meta-analysis of randomised trials. Knee. 2024;49:226-240. PMID 39043018; DOI 10.1016/j.knee.2024.07.002.
- [20]
[R20] Zhang XF, et al. Efficacy and safety of quadriceps tendon autograft versus bone-patellar tendon-bone and hamstring tendon autografts for anterior cruciate ligament reconstruction: a systematic review and meta-analysis. J Orthop Traumatol. 2024;25(1):65. PMID 39694948; DOI 10.1186/s10195-024-00801-2.
- [21]
[R21] Kaeding CC, et al. Allograft Versus Autograft Anterior Cruciate Ligament Reconstruction: Predictors of Failure From a MOON Prospective Longitudinal Cohort. Sports Health. 2011;3(1):73-81. PMID 23015994; DOI 10.1177/1941738110386185.
- [22]
[R22] Getgood AMJ, et al. Lateral Extra-articular Tenodesis Reduces Failure of Hamstring Tendon Autograft Anterior Cruciate Ligament Reconstruction: 2-Year Outcomes From the STABILITY Study Randomized Clinical Trial. Am J Sports Med. 2020;48(2):285-297. PMID 31940222; DOI 10.1177/0363546519896333; NCT02018354.
- [23]
[R23] Sonnery-Cottet B, et al. Anterior cruciate ligament reconstruction combined with anterolateral ligament reconstruction using hamstring autograft versus anterior cruciate ligament reconstruction using bone-patellar tendon-bone autograft: a randomised controlled trial with 5-year follow-up. Lancet Reg Health Eur. 2026;62:101561. PMID 41536854; DOI 10.1016/j.lanepe.2025.101561; NCT03740022.
- [24]
[R24] Mackenzie CEA, et al. Suture Tape Augmentation of Anterior Cruciate Ligament Reconstruction Increases Biomechanical Stability: A Scoping Review of Biomechanical, Animal, and Clinical Studies. Arthroscopy. 2022;38(6):2073-2089. PMID 34990759; DOI 10.1016/j.arthro.2021.12.036.
- [25]
[R25] Zheng T, et al. Suture tape augmentation, a novel application of synthetic materials in anterior cruciate ligament reconstruction: A systematic review. Front Bioeng Biotechnol. 2022;10:1065314. PMID 36686239; DOI 10.3389/fbioe.2022.1065314.
- [26]
[R26] Conde RB, et al. Anterior Cruciate Ligament Reconstruction With Hamstring Autografts and Suture Tape Augmentation Results in Lower Failure Rates While Maintaining Functional Outcomes and Complication Rates Similar to Nonaugmented Techniques: A Systematic Review and Meta-analysis. Am J Sports Med. 2026;54(6):1479-1494. PMID 41562435; DOI 10.1177/03635465251400346.
- [27]
[R27] Wilson WT, et al. Outcomes of Anterior Cruciate Ligament Reconstruction With Independently Tensioned Suture Tape Augmentation at 5-Year Follow-up. Am J Sports Med. 2023;51(14):3658-3664. PMID 37975527; DOI 10.1177/03635465231207623.
- [28]
[R28] Bachmaier S, et al. Independent Suture Tape Reinforcement of Small and Standard Diameter Grafts for Anterior Cruciate Ligament Reconstruction: A Biomechanical Full Construct Model. Arthroscopy. 2018;34(2):490-499. PMID 29275984; DOI 10.1016/j.arthro.2017.10.037.
- [29]
[R29] Desouza C, et al. Peroneus longus autograft versus hamstring tendon autograft in primary anterior cruciate ligament reconstruction: a systematic review and meta-analysis of randomised controlled trials. Eur J Orthop Surg Traumatol. 2026;36(1). PMID 42542493; DOI 10.1007/s00590-026-04907-7.
- [30]
[R30] Zaid HHG, Yang G, Xu H. Anterior Cruciate Ligament Reconstruction Using Autologous Hamstrings Augmented with Ligament Augmentation and Reconstruction Systems (LARS) or Synthetic Meshwork of LARS Compared with Four-Strand Hamstring Tendon Grafts Alone, a Prospective, Randomized Clinical Study with 2- to 8-Year Follow-Up. Indian J Orthop. 2023;57(9):1497-1509. PMID 37609011; DOI 10.1007/s43465-023-00956-w.
- [31]
[R31] Zaid HHG, et al. Clinical and arthroscopic outcomes of single-bundle anterior cruciate ligament reconstruction using autologous hamstrings augmented with ligament augmentation and reconstruction systems compared with four-strand hamstring tendon grafts alone. Int Orthop. 2023;47(1):151-164. PMID 36156178; DOI 10.1007/s00264-022-05588-7. Same hospital and team as [R30]; enrollment periods overlap.
- [32]
[R32] Aujla RS, Ebert JR, Annear PT. Anterior Cruciate Ligament Reconstruction Using Autologous Hamstrings Augmented With the Ligament Augmentation and Reconstruction System Versus Hamstrings Alone: A Comparative Cohort Study. Orthop J Sports Med. 2021;9(10):23259671211046631. PMID 34708141; DOI 10.1177/23259671211046631.
- [33]
[R33] Ebert JR, et al. Double-bundle anterior cruciate ligament reconstruction using autologous hamstrings with LARS augmentation demonstrates comparable outcomes to hamstrings alone, without evidence of synovitis or early osteoarthritis. Knee Surg Sports Traumatol Arthrosc. 2022;30(7):2320-2328. PMID 34839367; DOI 10.1007/s00167-021-06801-7.
- [34]
[R34] Qurashi S, et al. 8-11 year results of LARS augmented hamstring in anterior cruciate ligament reconstruction surgery: Incidence of synovitis and failures. J Orthop. 2025;66:252-256. PMID 41631290; DOI 10.1016/j.jor.2025.06.033.
- [35]
[R35] Antzoulas P, et al. LARS-augmented hamstring ACL reconstruction shows better early but similar long-term outcomes compared with hamstring autograft alone: A systematic review and meta-analysis. J Exp Orthop. 2026;13(1):e70654. PMID 41743308; DOI 10.1002/jeo2.70654; PROSPERO CRD42024536835.
- [36]
[R36] Wenlong H, Maosheng Y, Hanbin W, Yi L. Early clinical outcomes of all-inside arthroscopic anterior cruciate ligament reconstruction with autograft tendon augmentation using the LARS internal brace ligament. Front Bioeng Biotechnol. 2025;13:1556106. PMID 40304007; DOI 10.3389/fbioe.2025.1556106.
- [37]
[R37] Codorean IB, et al. All-Inside Primary Anterior Cruciate Ligament Reconstruction Using a Combined Polyester Synthetic Graft and Gracilis Tendon Autograft: Modified Technique of a Hybrid 4 × 2 Graft Preparation. Arthrosc Tech. 2026;15(7):e70084. PMID 42519637; DOI 10.1002/atn2.70084. Technical article; no comparative clinical outcomes.
- [38]
[R38] Hamido F, et al. Augmented short undersized hamstring tendon graft with LARS® artificial ligament versus four-strand hamstring tendon in anterior cruciate ligament reconstruction: preliminary results. Orthop Traumatol Surg Res. 2015;101(5):535-538. PMID 25998274; DOI 10.1016/j.otsr.2015.01.021.
- [39]
[R39] Chen T, et al. Long-Term Outcomes of Anterior Cruciate Ligament Reconstruction Using Either Synthetics With Remnant Preservation or Hamstring Autografts: A 10-Year Longitudinal Study. Am J Sports Med. 2017;45(12):2739-2750. PMID 28892648; DOI 10.1177/0363546517721692.
- [40]
[R40] Chinese Artificial Ligament Research Group. Multicenter clinical survey of adverse events after primary anterior cruciate ligament reconstruction with an advanced ligament augmentation device. Zhonghua Yi Xue Za Zhi. 2022;102(41):3312-3320. PMID 36319184; DOI 10.3760/cma.j.cn112137-20220530-01192.
- [41]
[R41] Tulloch SJ, et al. Primary ACL reconstruction using the LARS device is associated with a high failure rate at minimum of 6-year follow-up. Knee Surg Sports Traumatol Arthrosc. 2019;27(11):3626-3632. PMID 30903217; DOI 10.1007/s00167-019-05478-3.
- [42]
[R42] Li H, et al. Biologic failure of a ligament advanced reinforcement system artificial ligament in anterior cruciate ligament reconstruction: a report of serious knee synovitis. Arthroscopy. 2012;28(4):583-586. PMID 22361004; DOI 10.1016/j.arthro.2011.12.008.
- [43]
[R43] Gao K, et al. Anterior cruciate ligament reconstruction with LARS artificial ligament: a multicenter study with 3- to 5-year follow-up. Arthroscopy. 2010;26(4):515-523. PMID 20362832; DOI 10.1016/j.arthro.2010.02.001.
- [44]
[R44] Fan L, et al. Comparison of clinical outcomes between hamstring tendon autografts and hybrid grafts in ACL reconstruction: a systematic review and meta-analysis. J Orthop Surg Res. 2024;19(1):809. PMID 39609872; DOI 10.1186/s13018-024-05310-w. Here hybrid means hamstring autograft plus allograft tendon and contains no artificial ligament.